Example results
These are unedited results from finished reviews. Click any figure to enlarge it. To learn how to read a timeline, see Step 7 of the tutorial. The requests behind several of these reviews are on Example requests.
Every review produces a spreadsheet and, unless you skip it, a timeline. A written review is optional. The tutorial shows rows from a real spreadsheet.
Timelines
Each timeline below comes from a different review. Each lane is a family of papers that share a claim, and each dot is one paper.
Differences across cortical layers
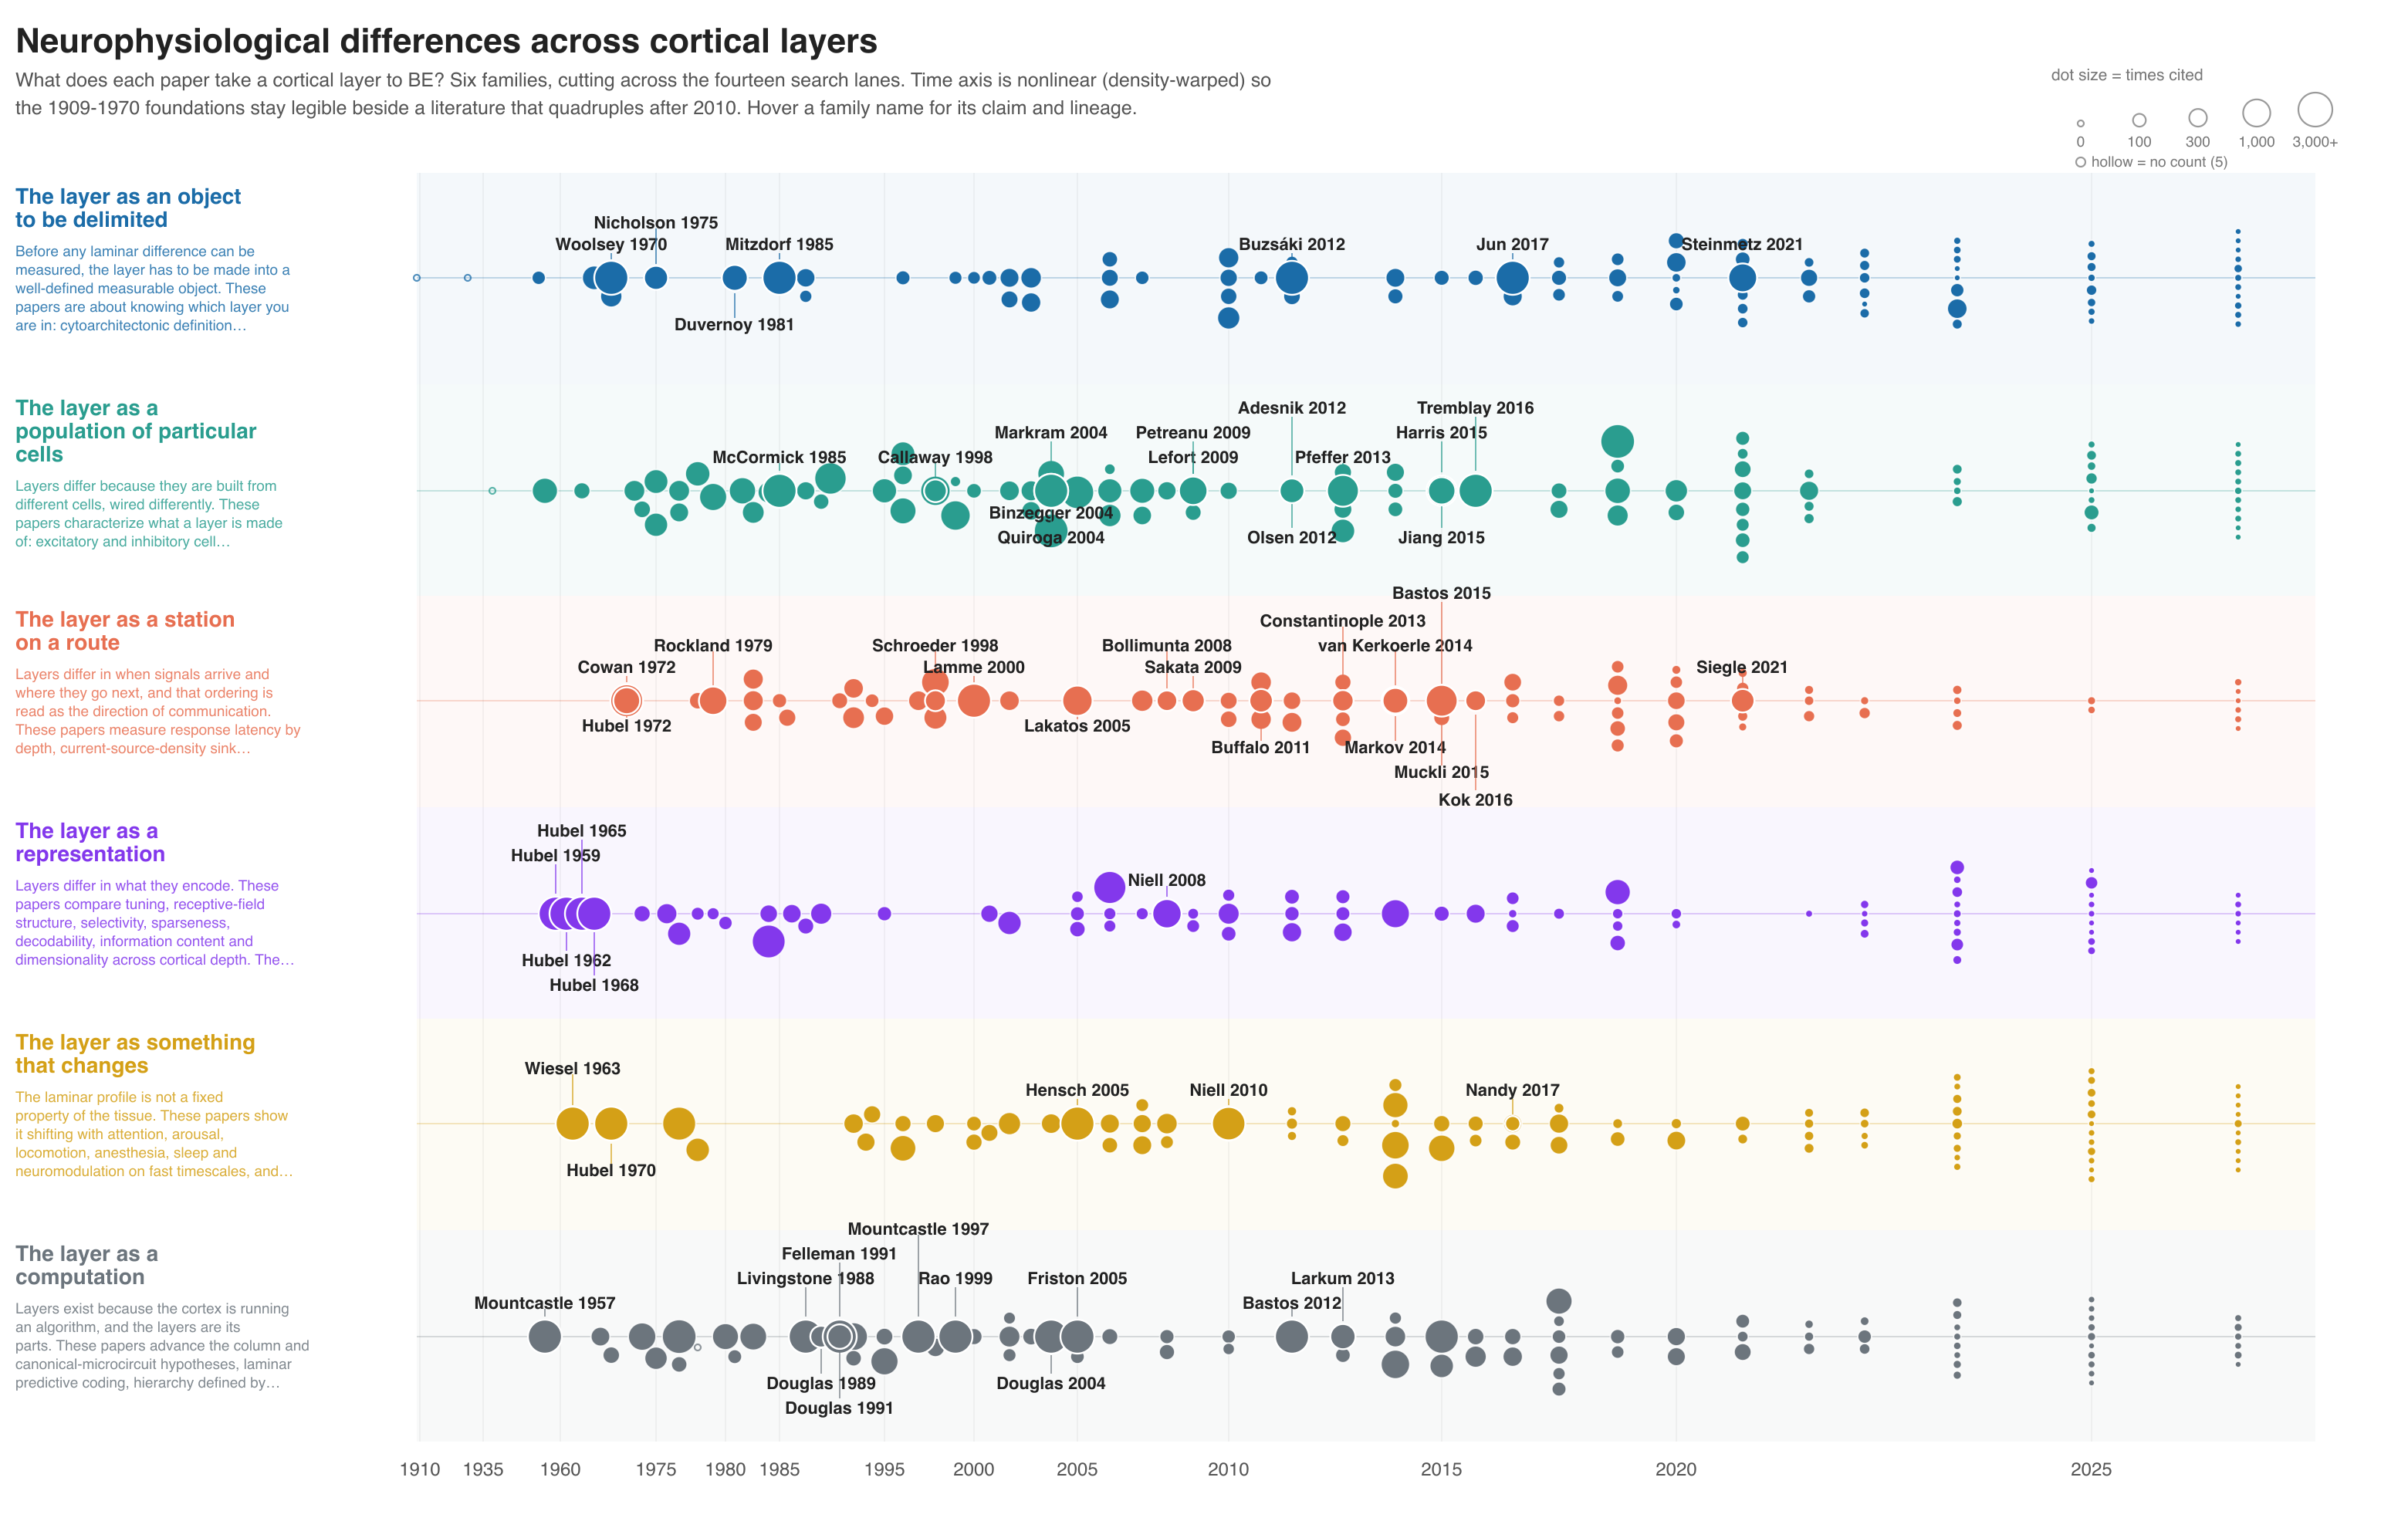
Six answers to the question "what is a cortical layer?" 555 papers, 1909–2026. The families treat a layer as a boundary to measure, a population of cells, a station on a signal's route, a representation, something that changes, or a step in a computation. The "representation" lane rests on Hubel and Wiesel's work from 1959 to 1968; most of the "something that changes" lane is recent. Request.
Creatine deficiency
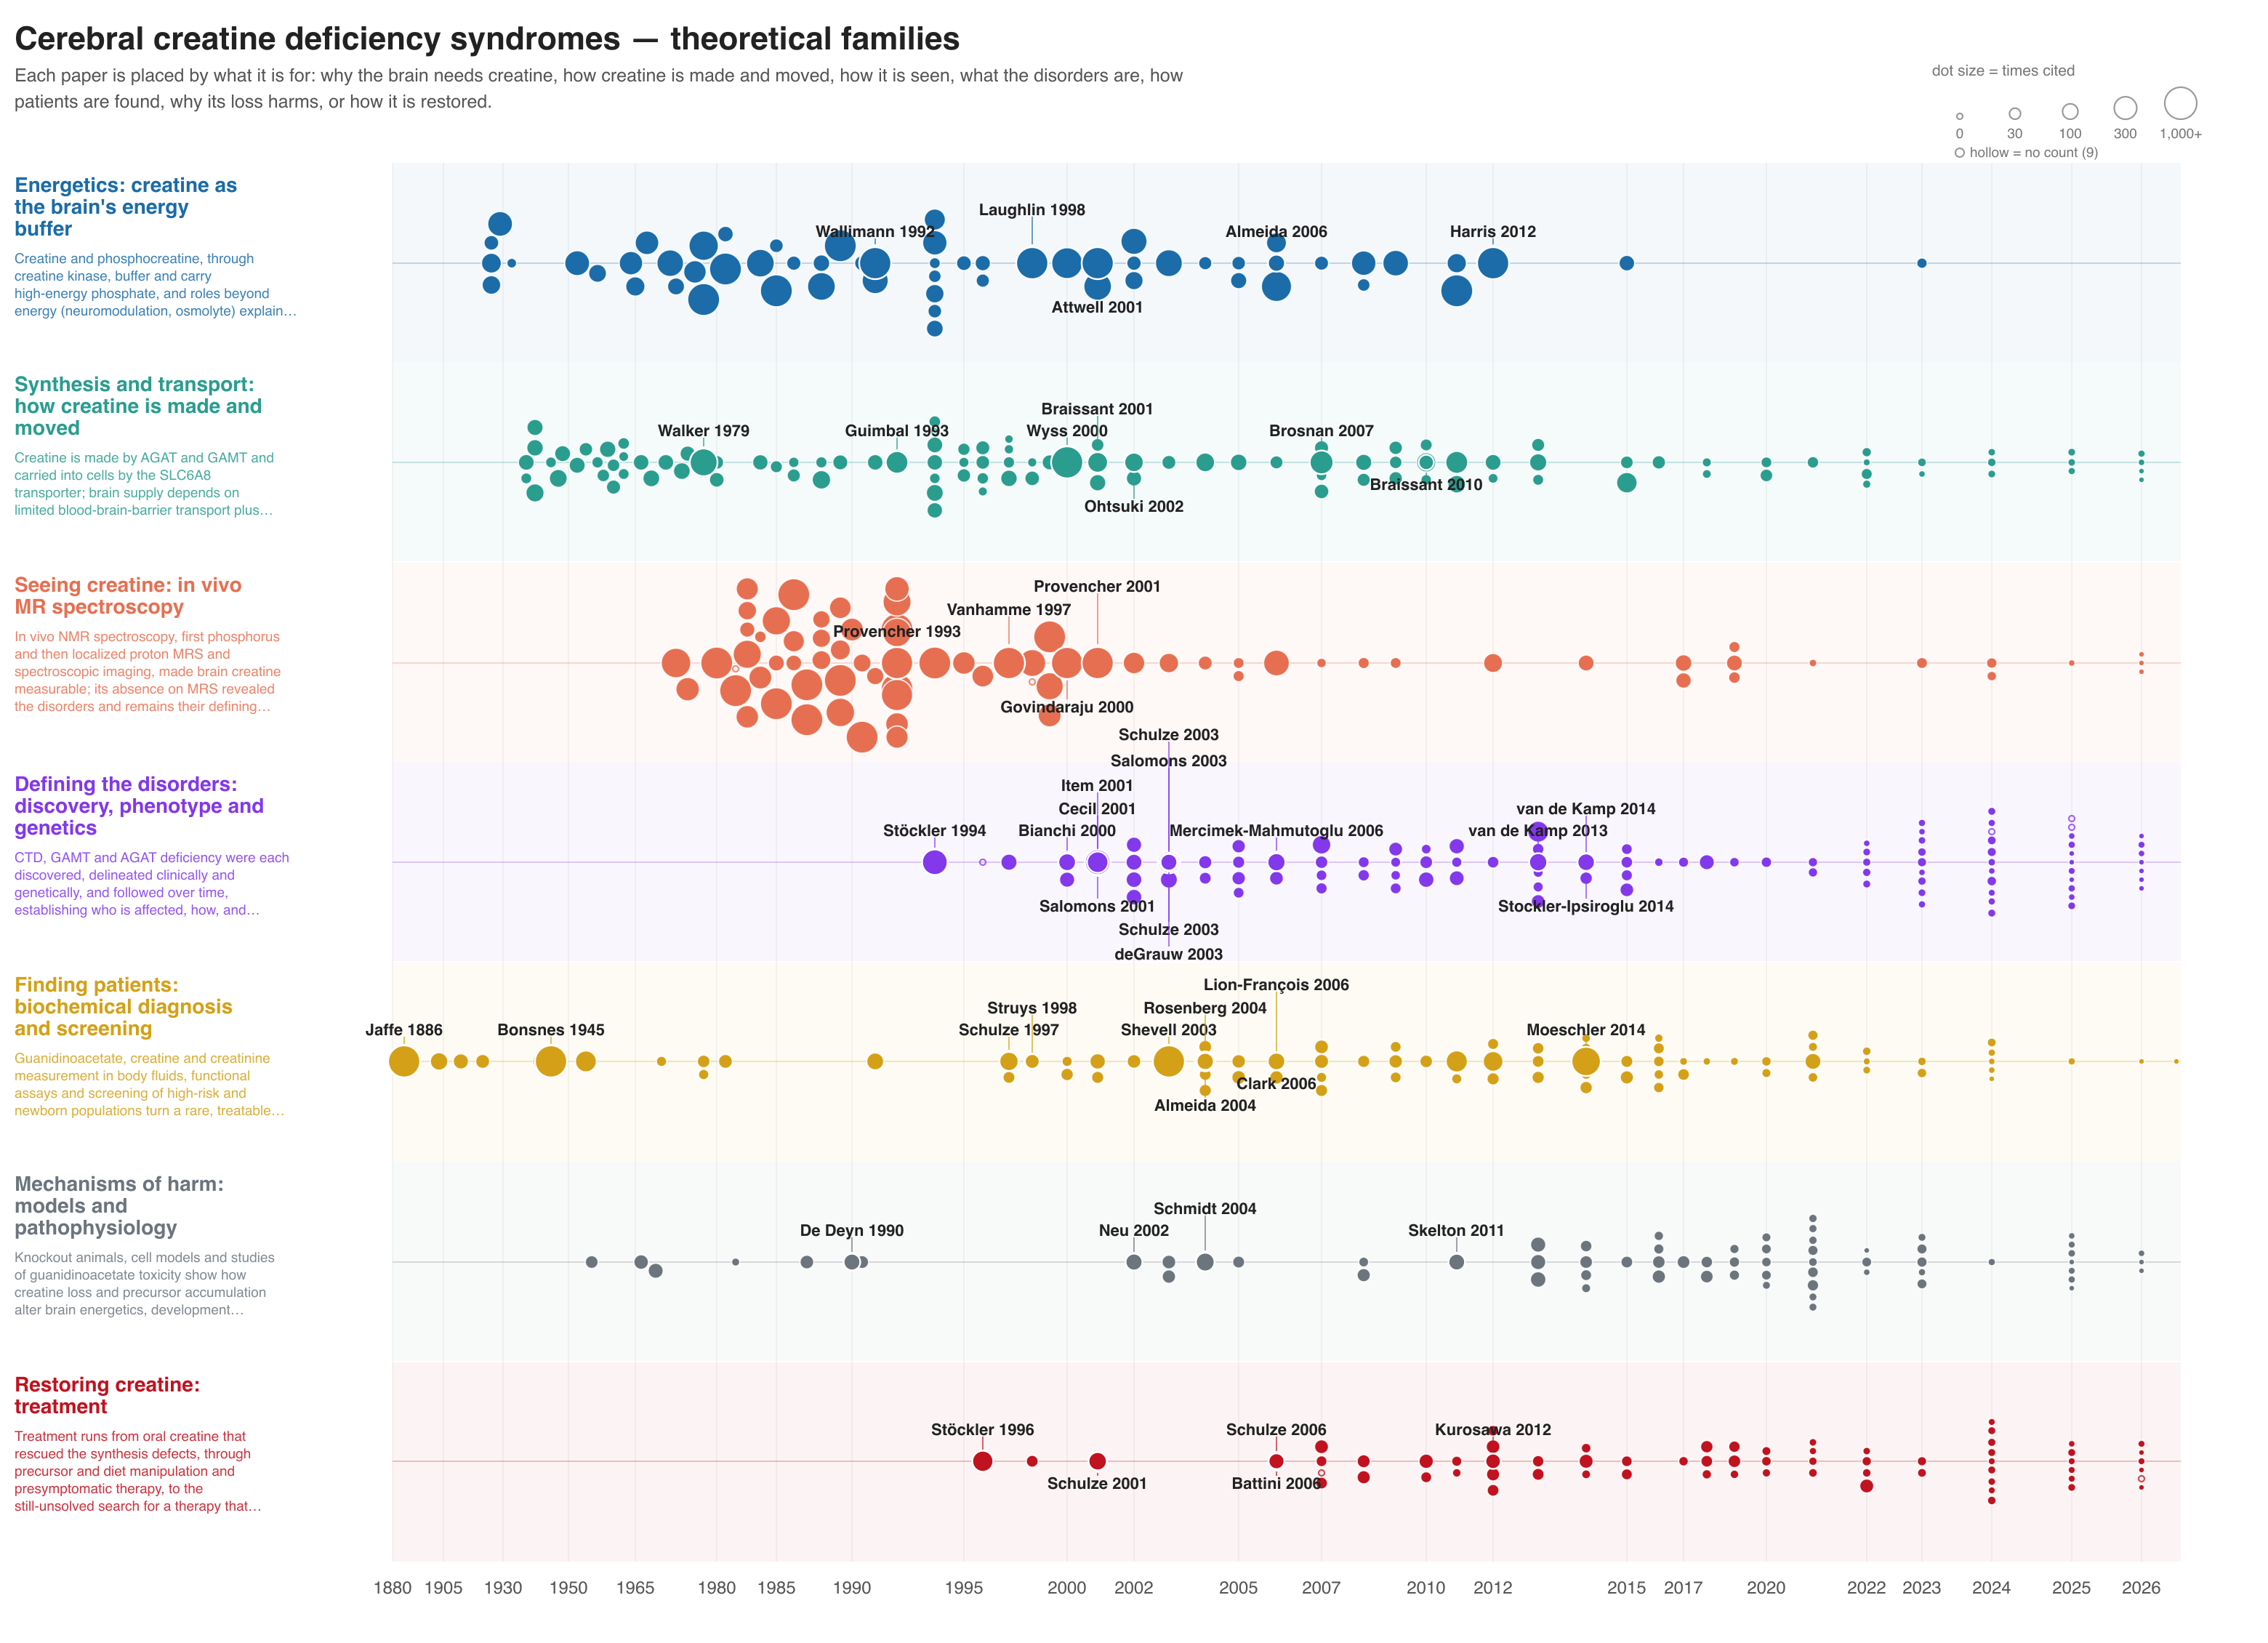
From the chemistry of creatine to the search for a treatment. 587 papers, 1886–2026. The families run from energy metabolism, synthesis and imaging, through defining the disorders and finding patients, to how the loss harms the brain and how to restore it. Most imaging papers date from 1980–2000, while the treatment lane is still growing. Request.
This review's complete output is available to open: the spreadsheet, the interactive timeline and the written review.
How the brain represents complexity
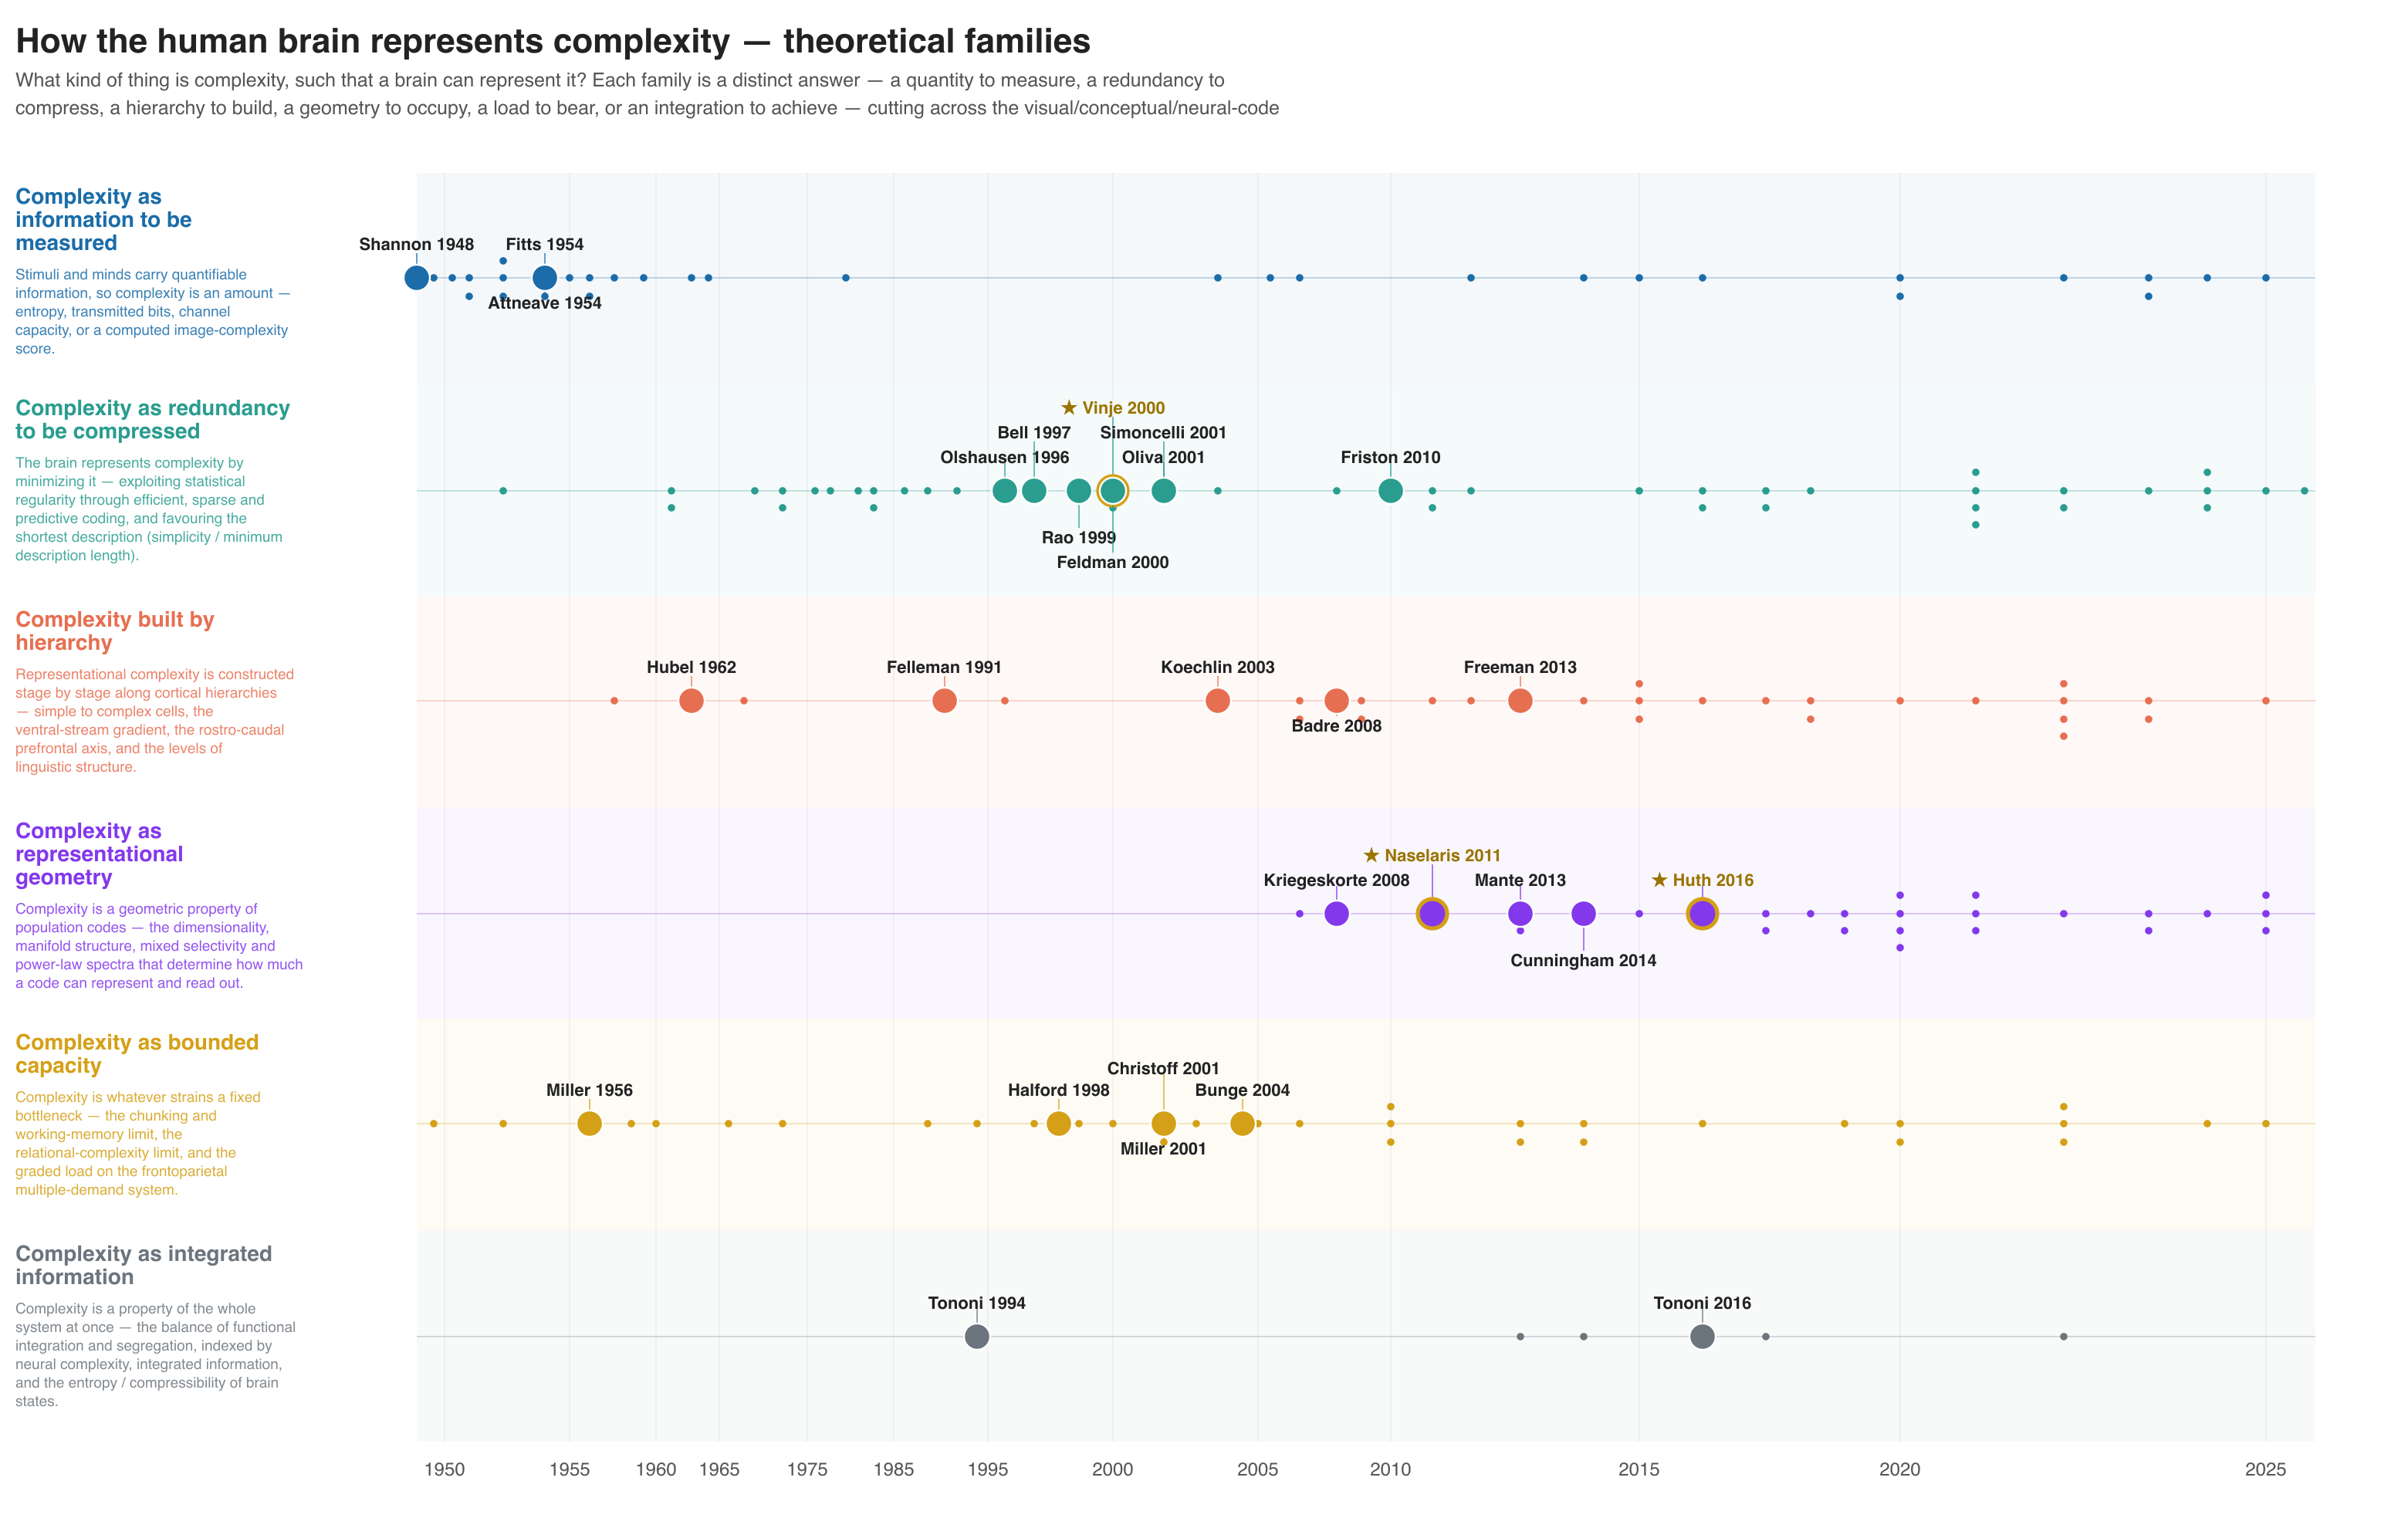
Six answers to "what is complexity?" 190 papers, 1948–2026. The families treat complexity as information, redundancy to compress, hierarchy, representational geometry, bounded capacity, or integrated information. Three of them rest on landmarks from the 1950s; the geometry lane starts in the mid-2000s.
The cognitive map
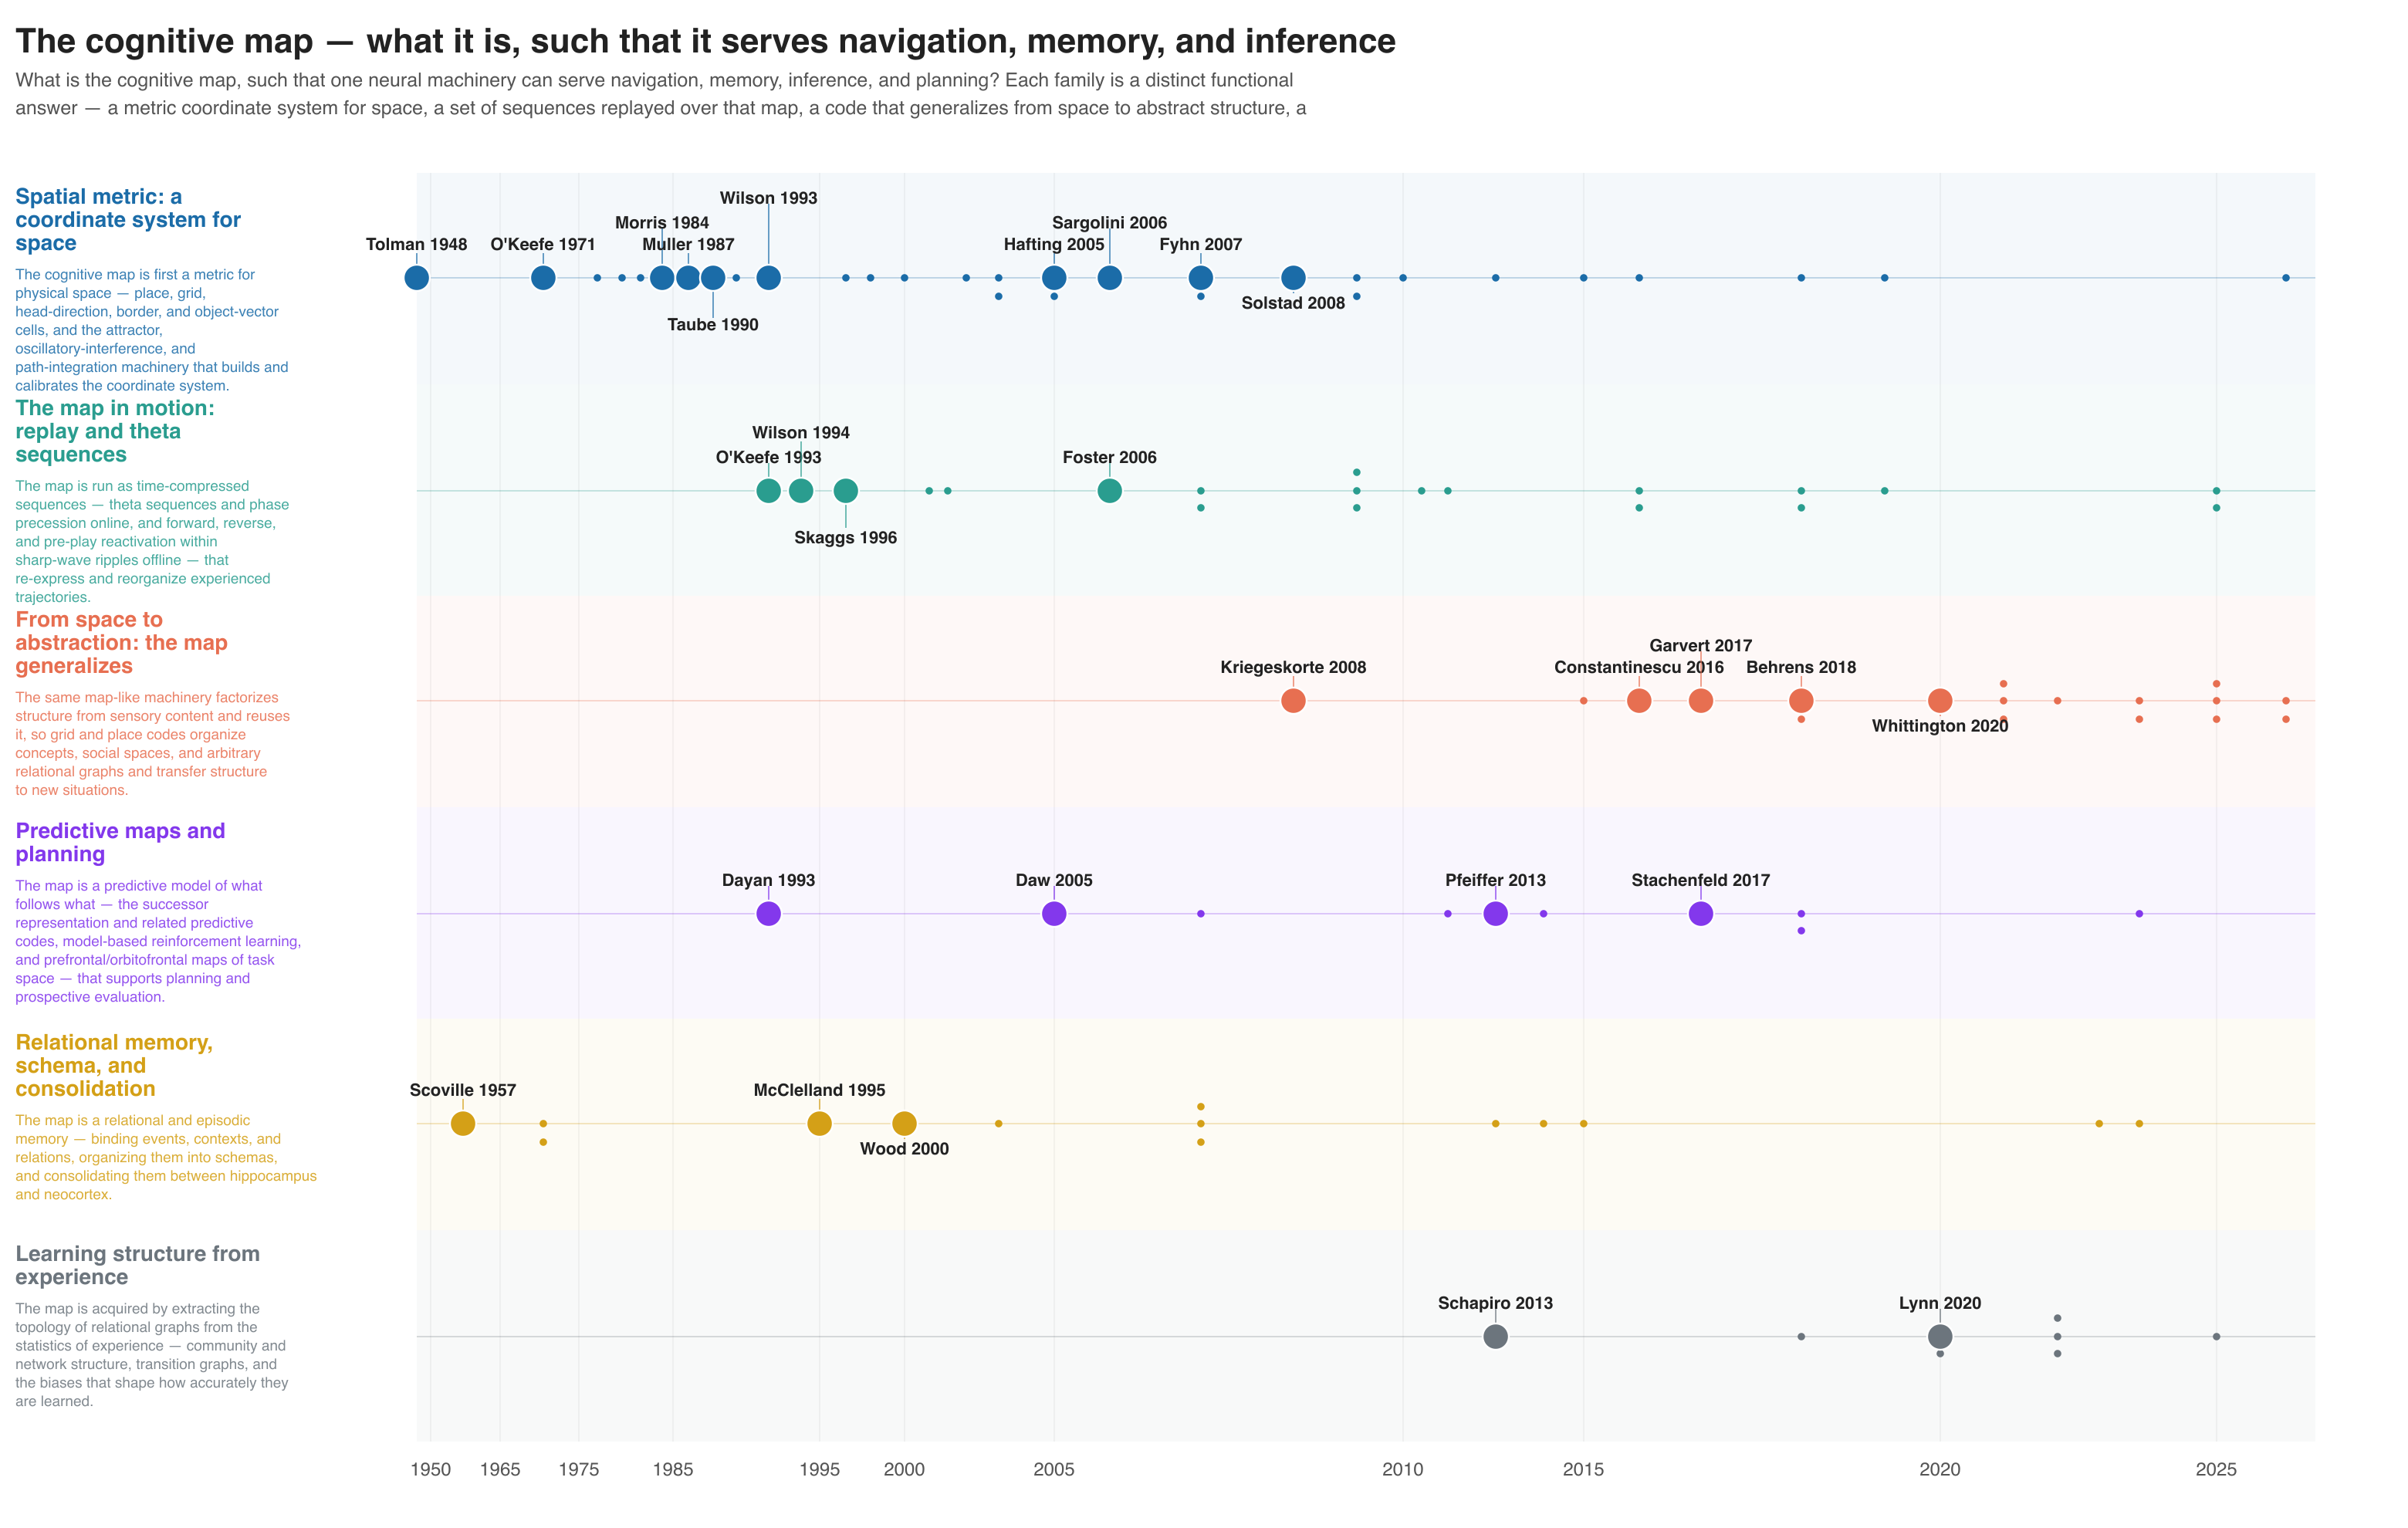
Six accounts of what the brain's map is for. 110 papers, 1948–2026. The families treat the map as a spatial metric, replayed sequences, abstract structure, prediction and planning, relational memory, or structure learned from experience. Maps of abstract, non-spatial structure appear only from 2008.
World models
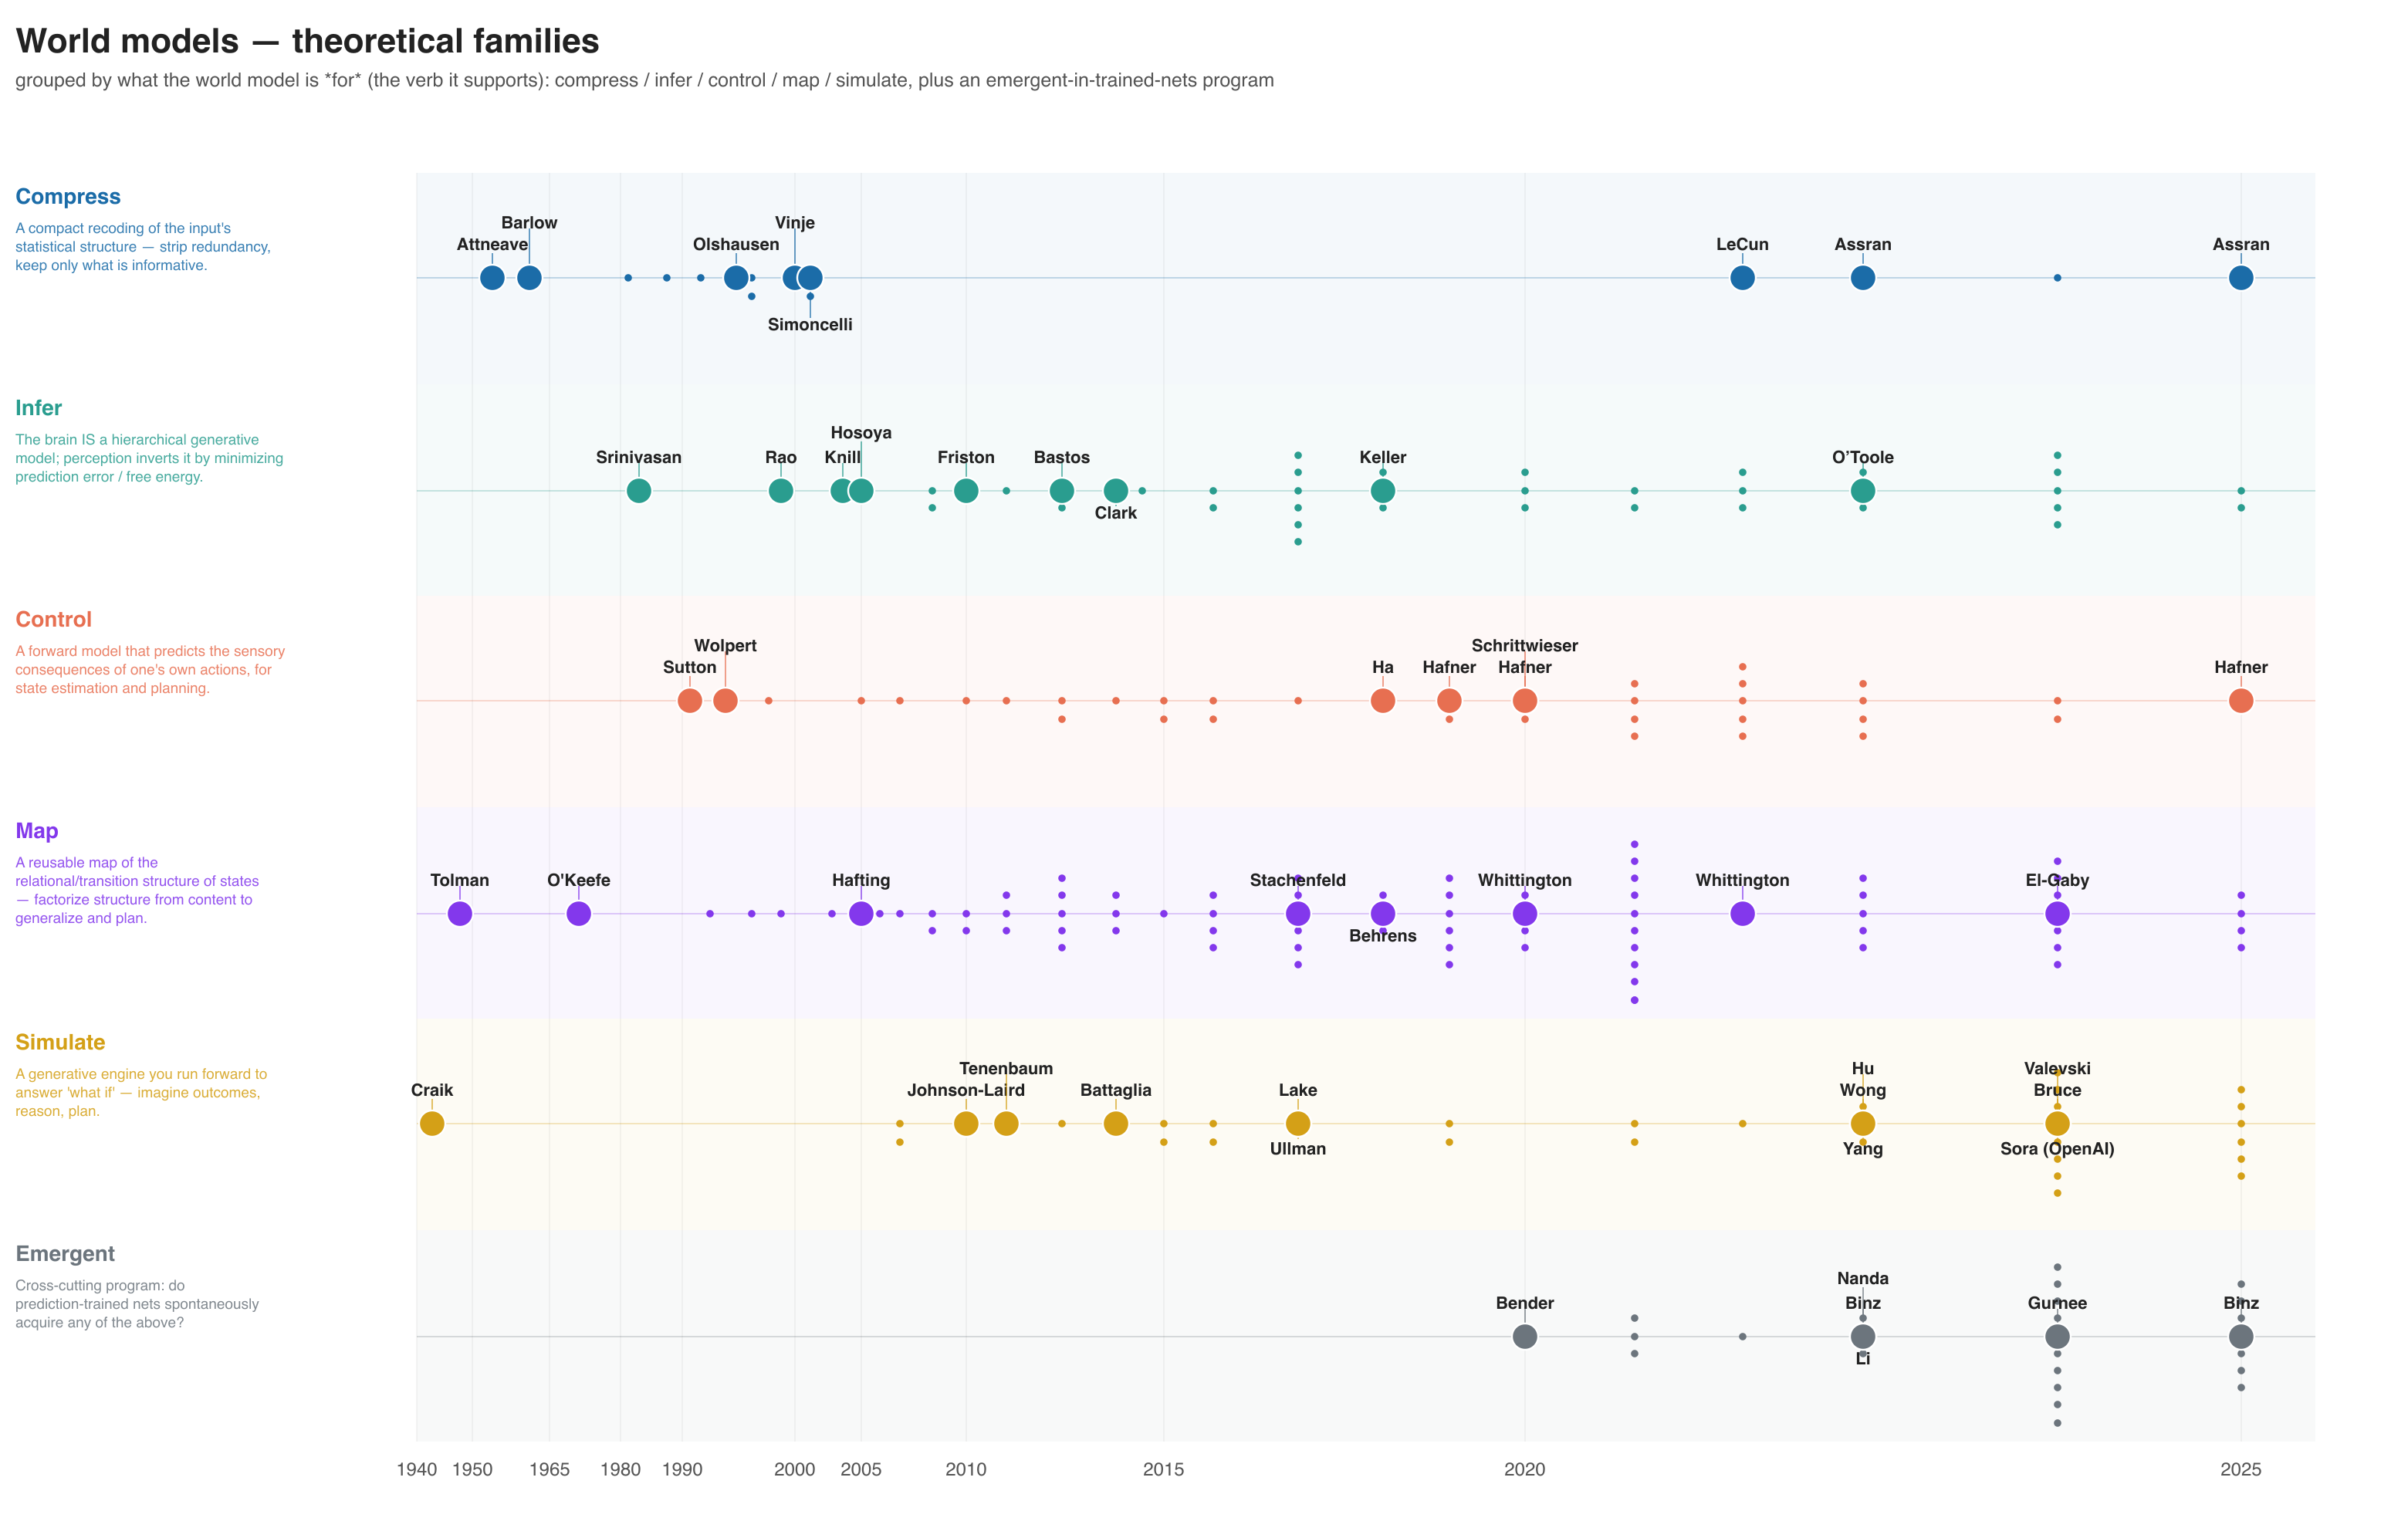
Six things a world model can do. 348 papers, 1943–2026. The families are named for what the model does: compress, infer, control, map, simulate, or emerge in trained networks. The compression lane is almost all before 2005; the simulation and emergence lanes are densest in 2023–2025.
Concepts in the brain
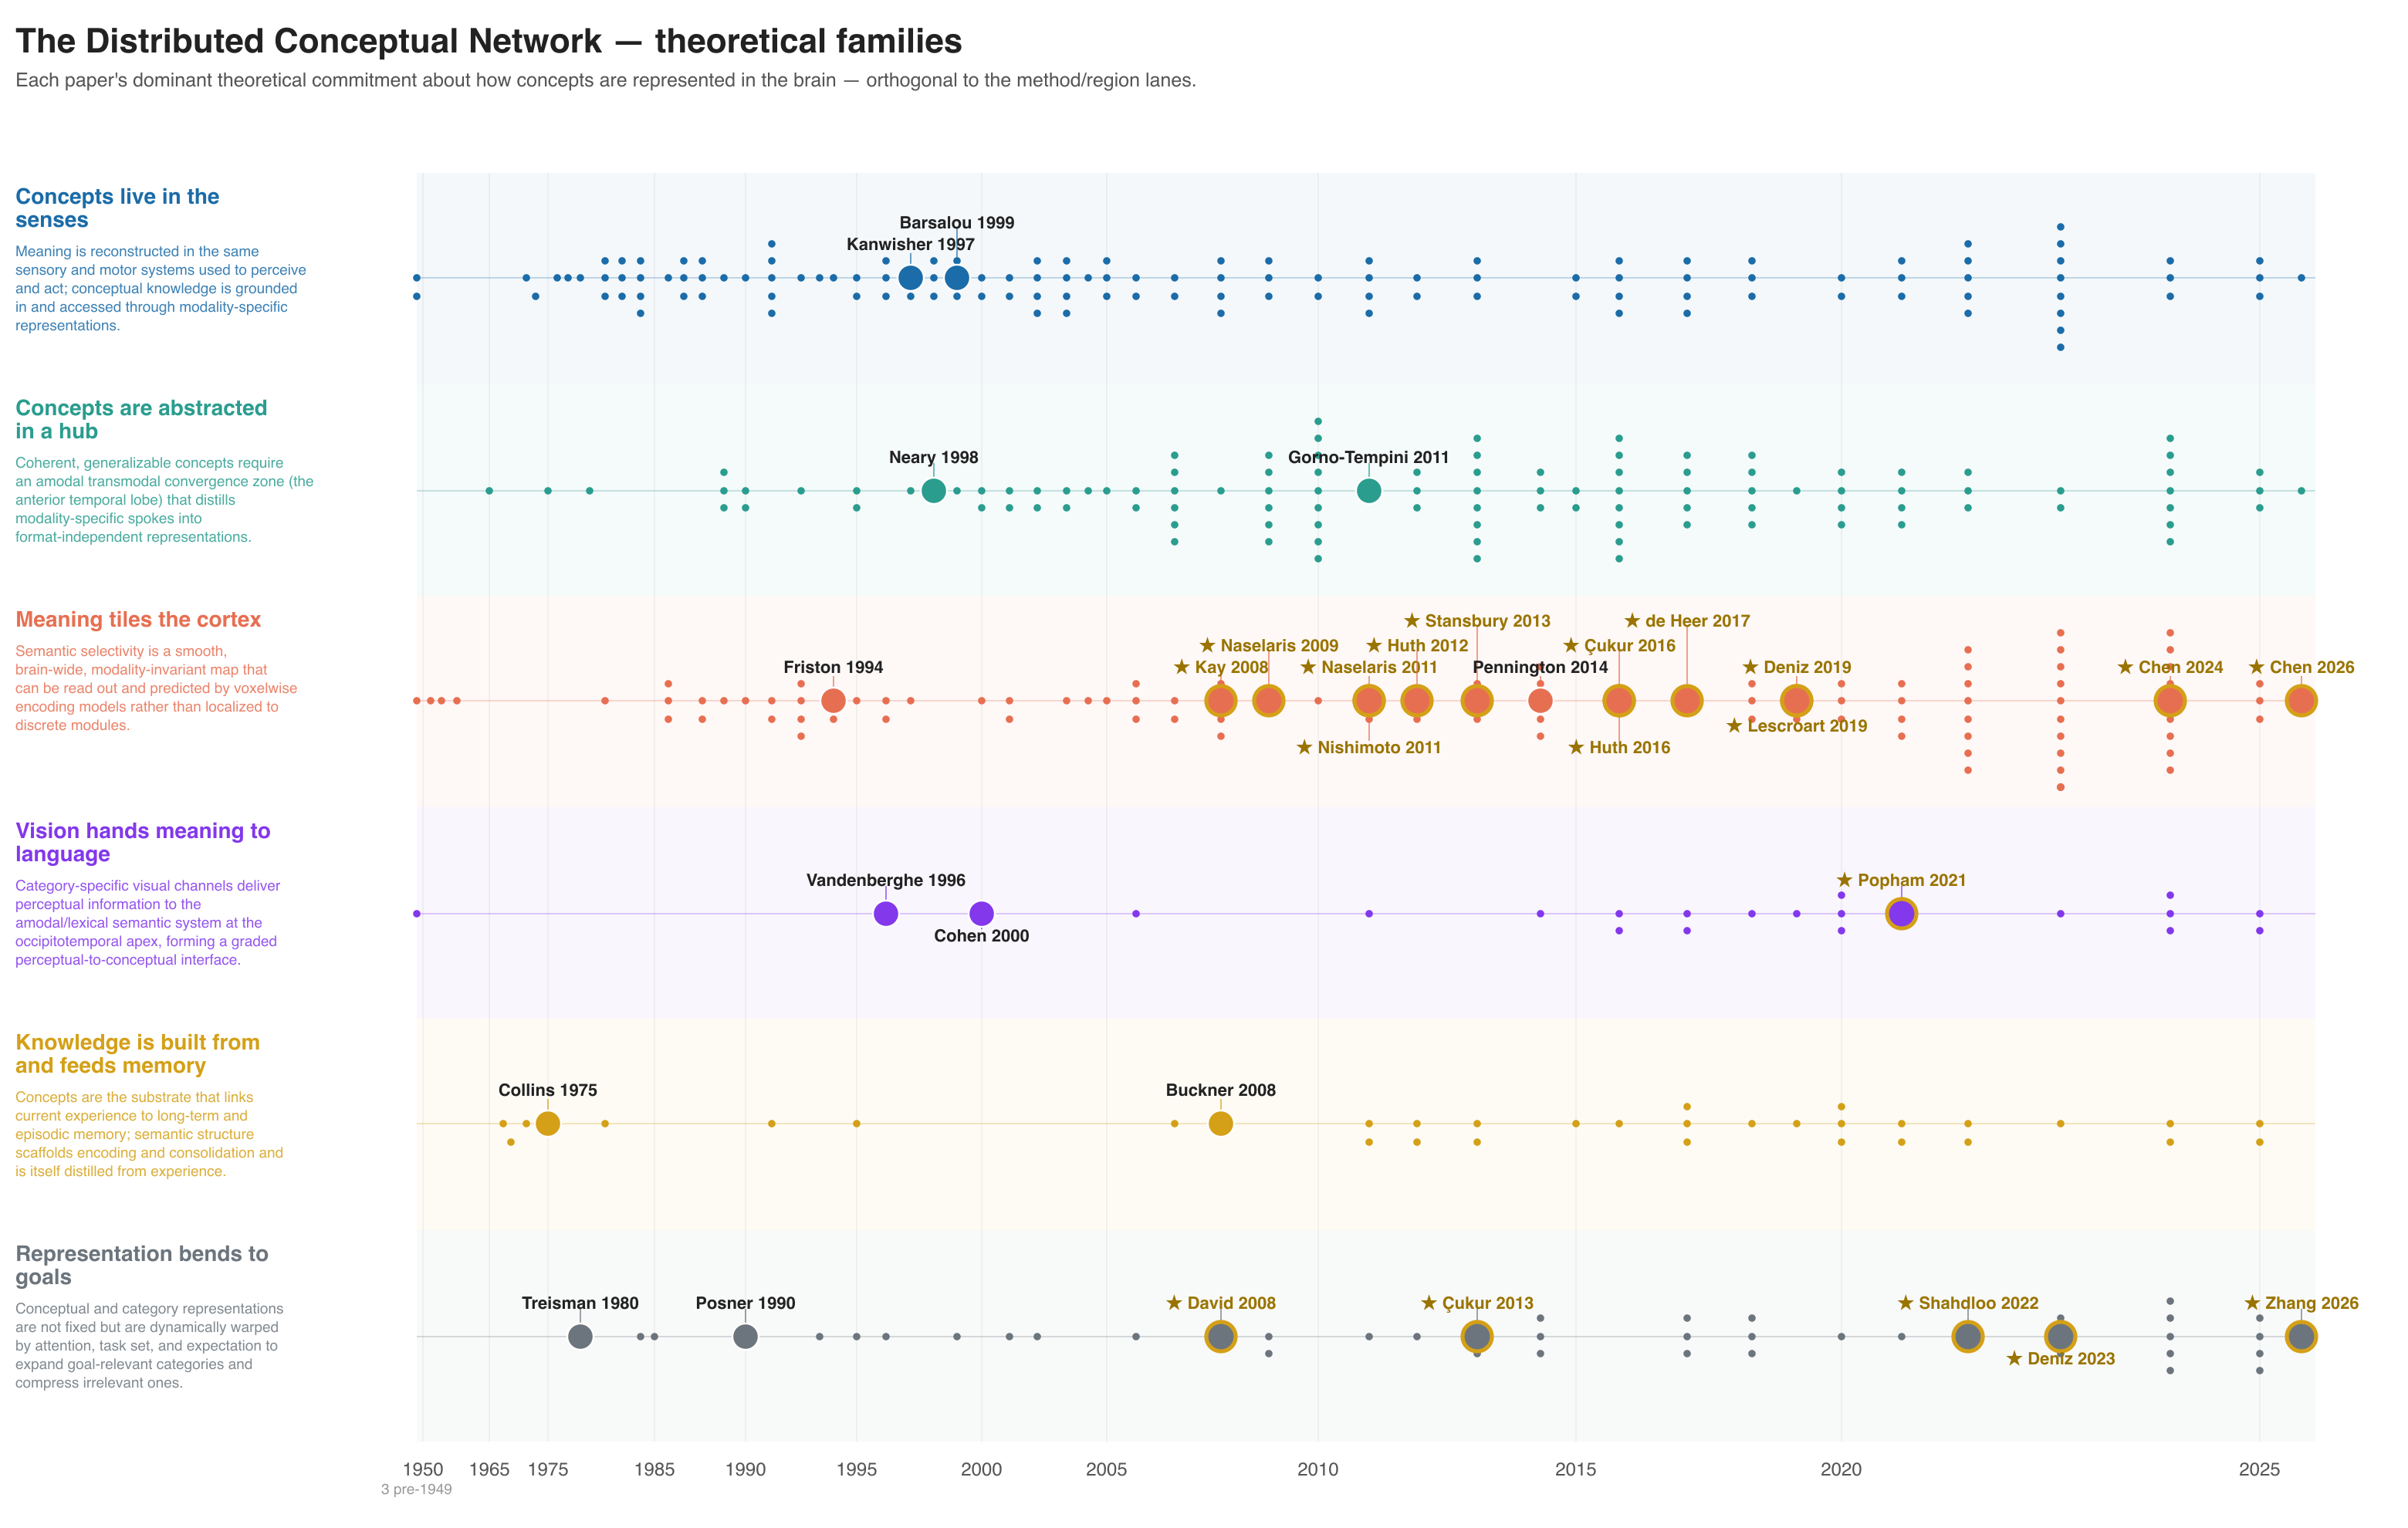
Six accounts of where concepts are stored. 450 papers, 1950–2026. Concepts live in sensory and motor systems, in a central hub, in a map across cortex, in a handoff from vision to language, in memory, or shaped by goals. Papers from the home lab, marked with stars, cluster in the "map across cortex" lane.
Data structures in the brain
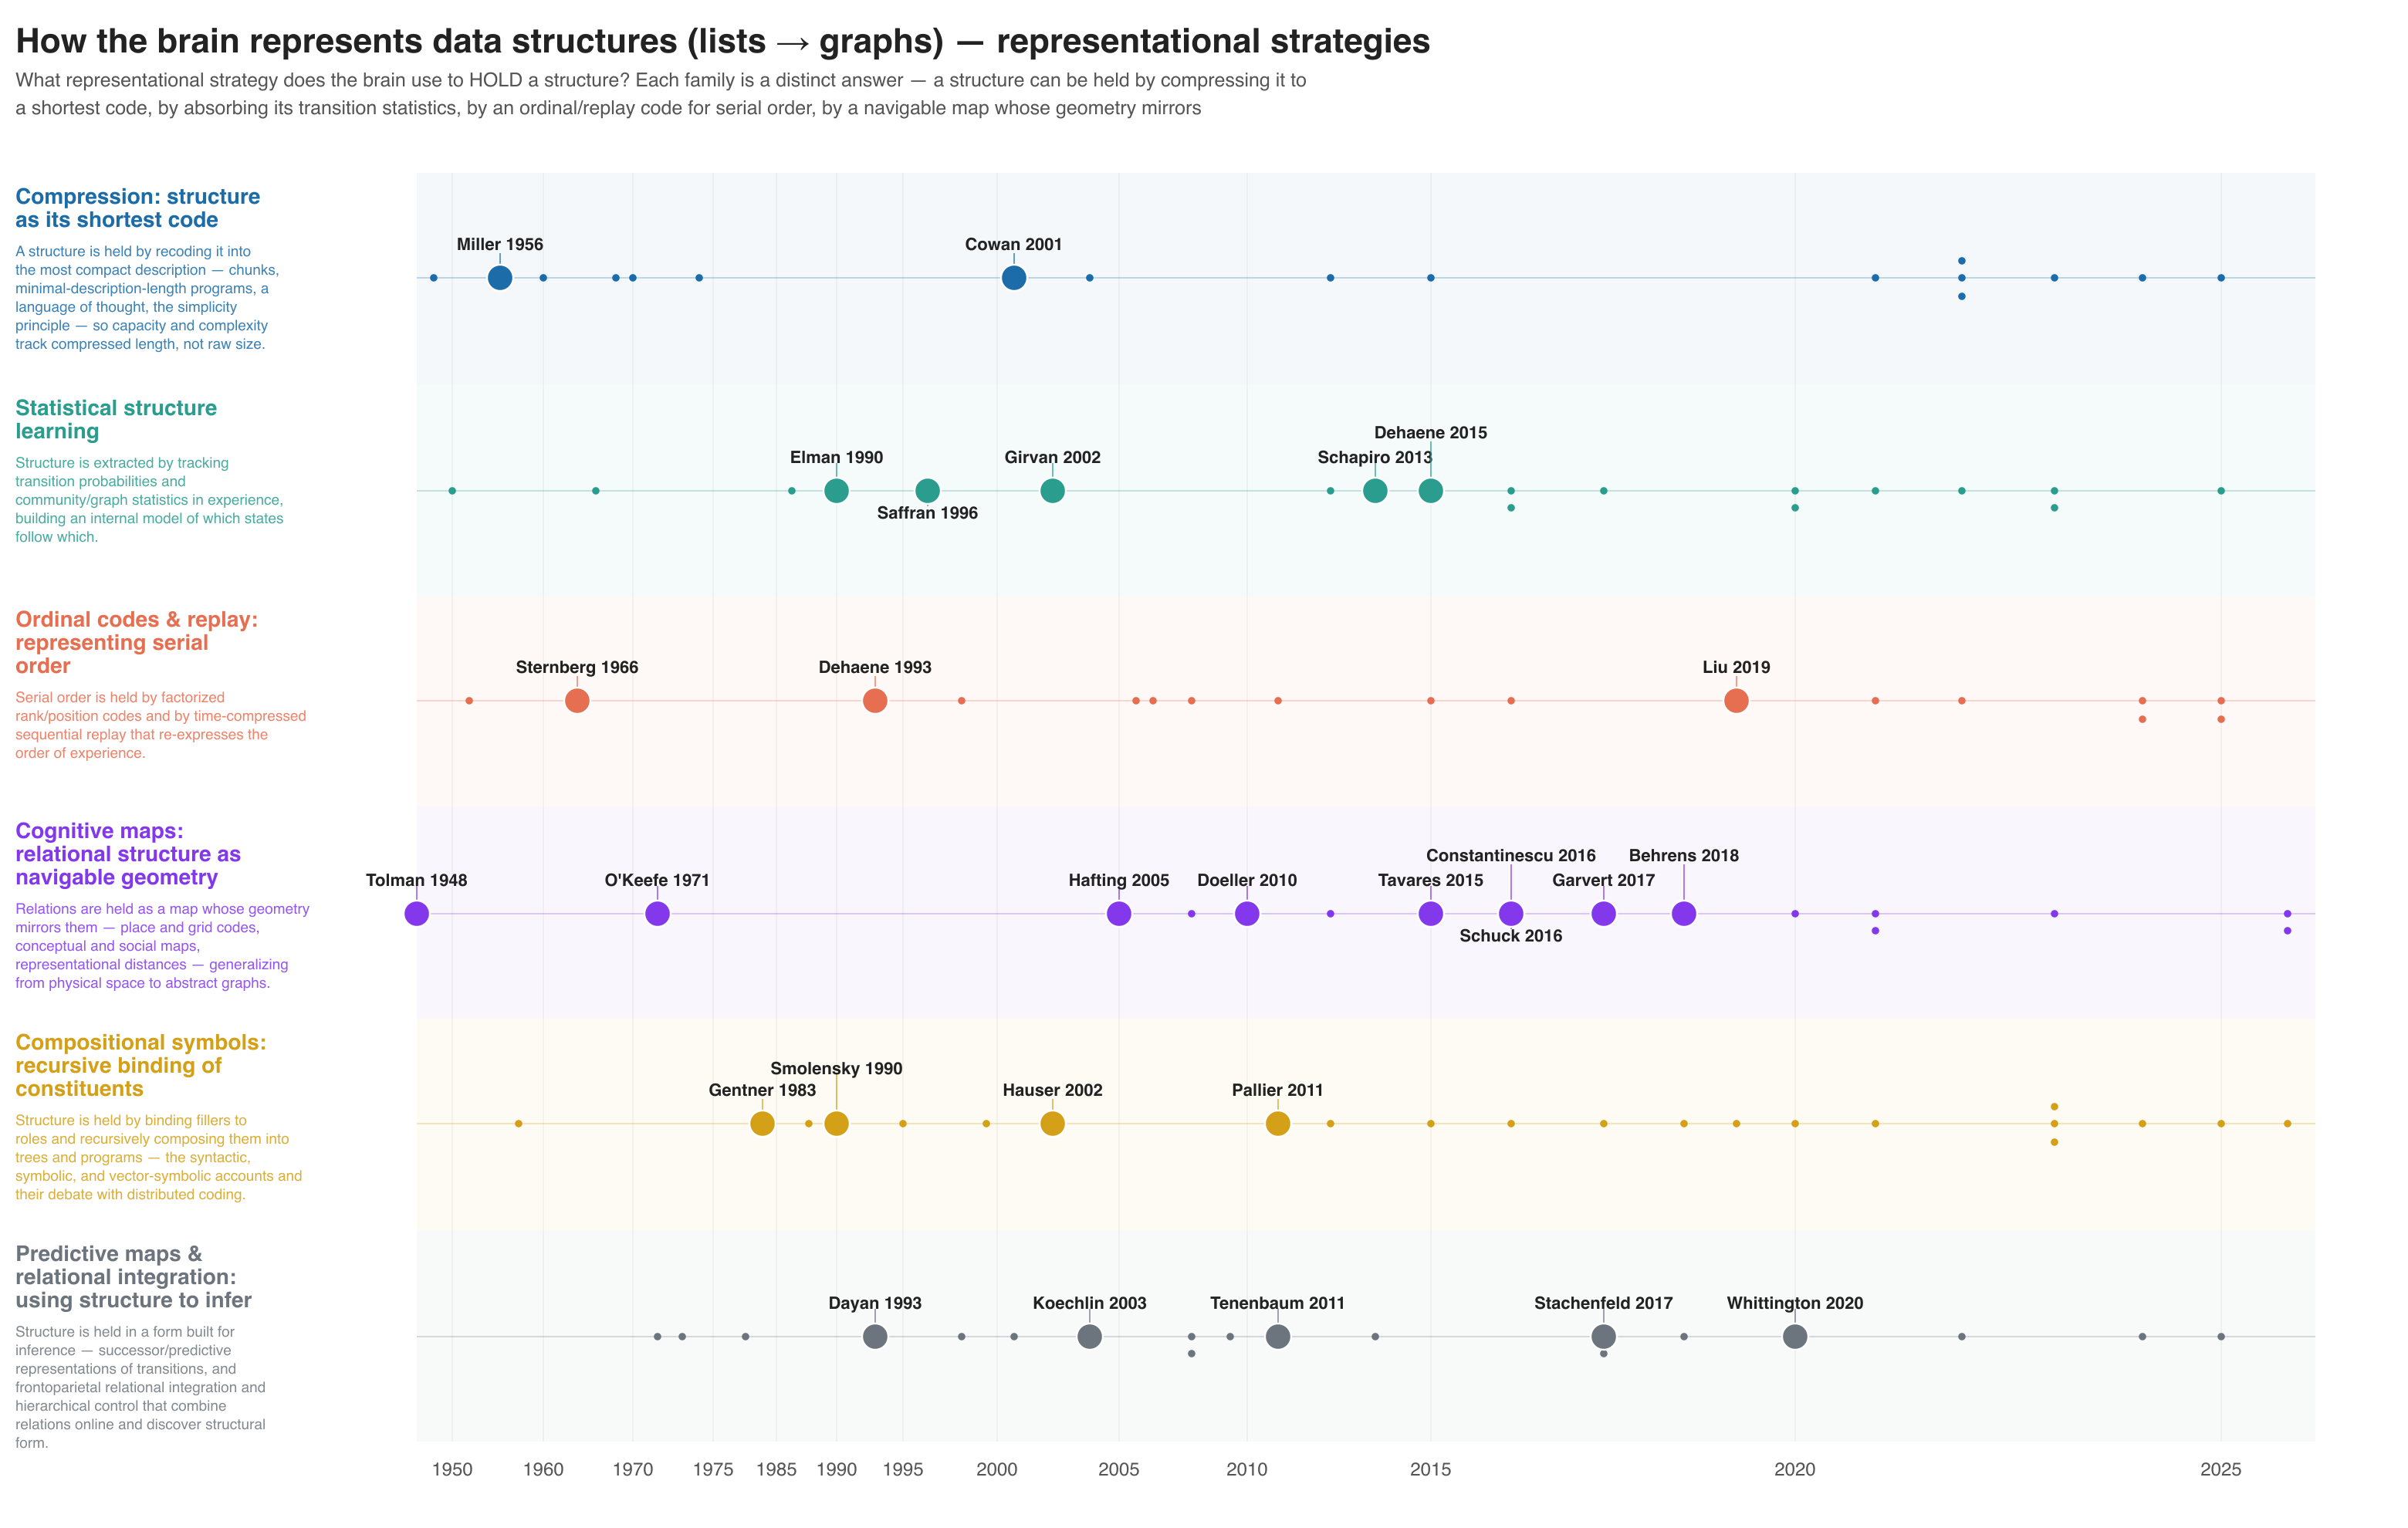
Six strategies for holding a structure in mind. 117 papers, 1948–2026. Compression, statistical learning, codes for order, cognitive maps, symbols that combine, and predictive maps. Each strategy has roots between 1948 and 1990; the cognitive-map lane grows fastest after 2005.
The evolution of the language network
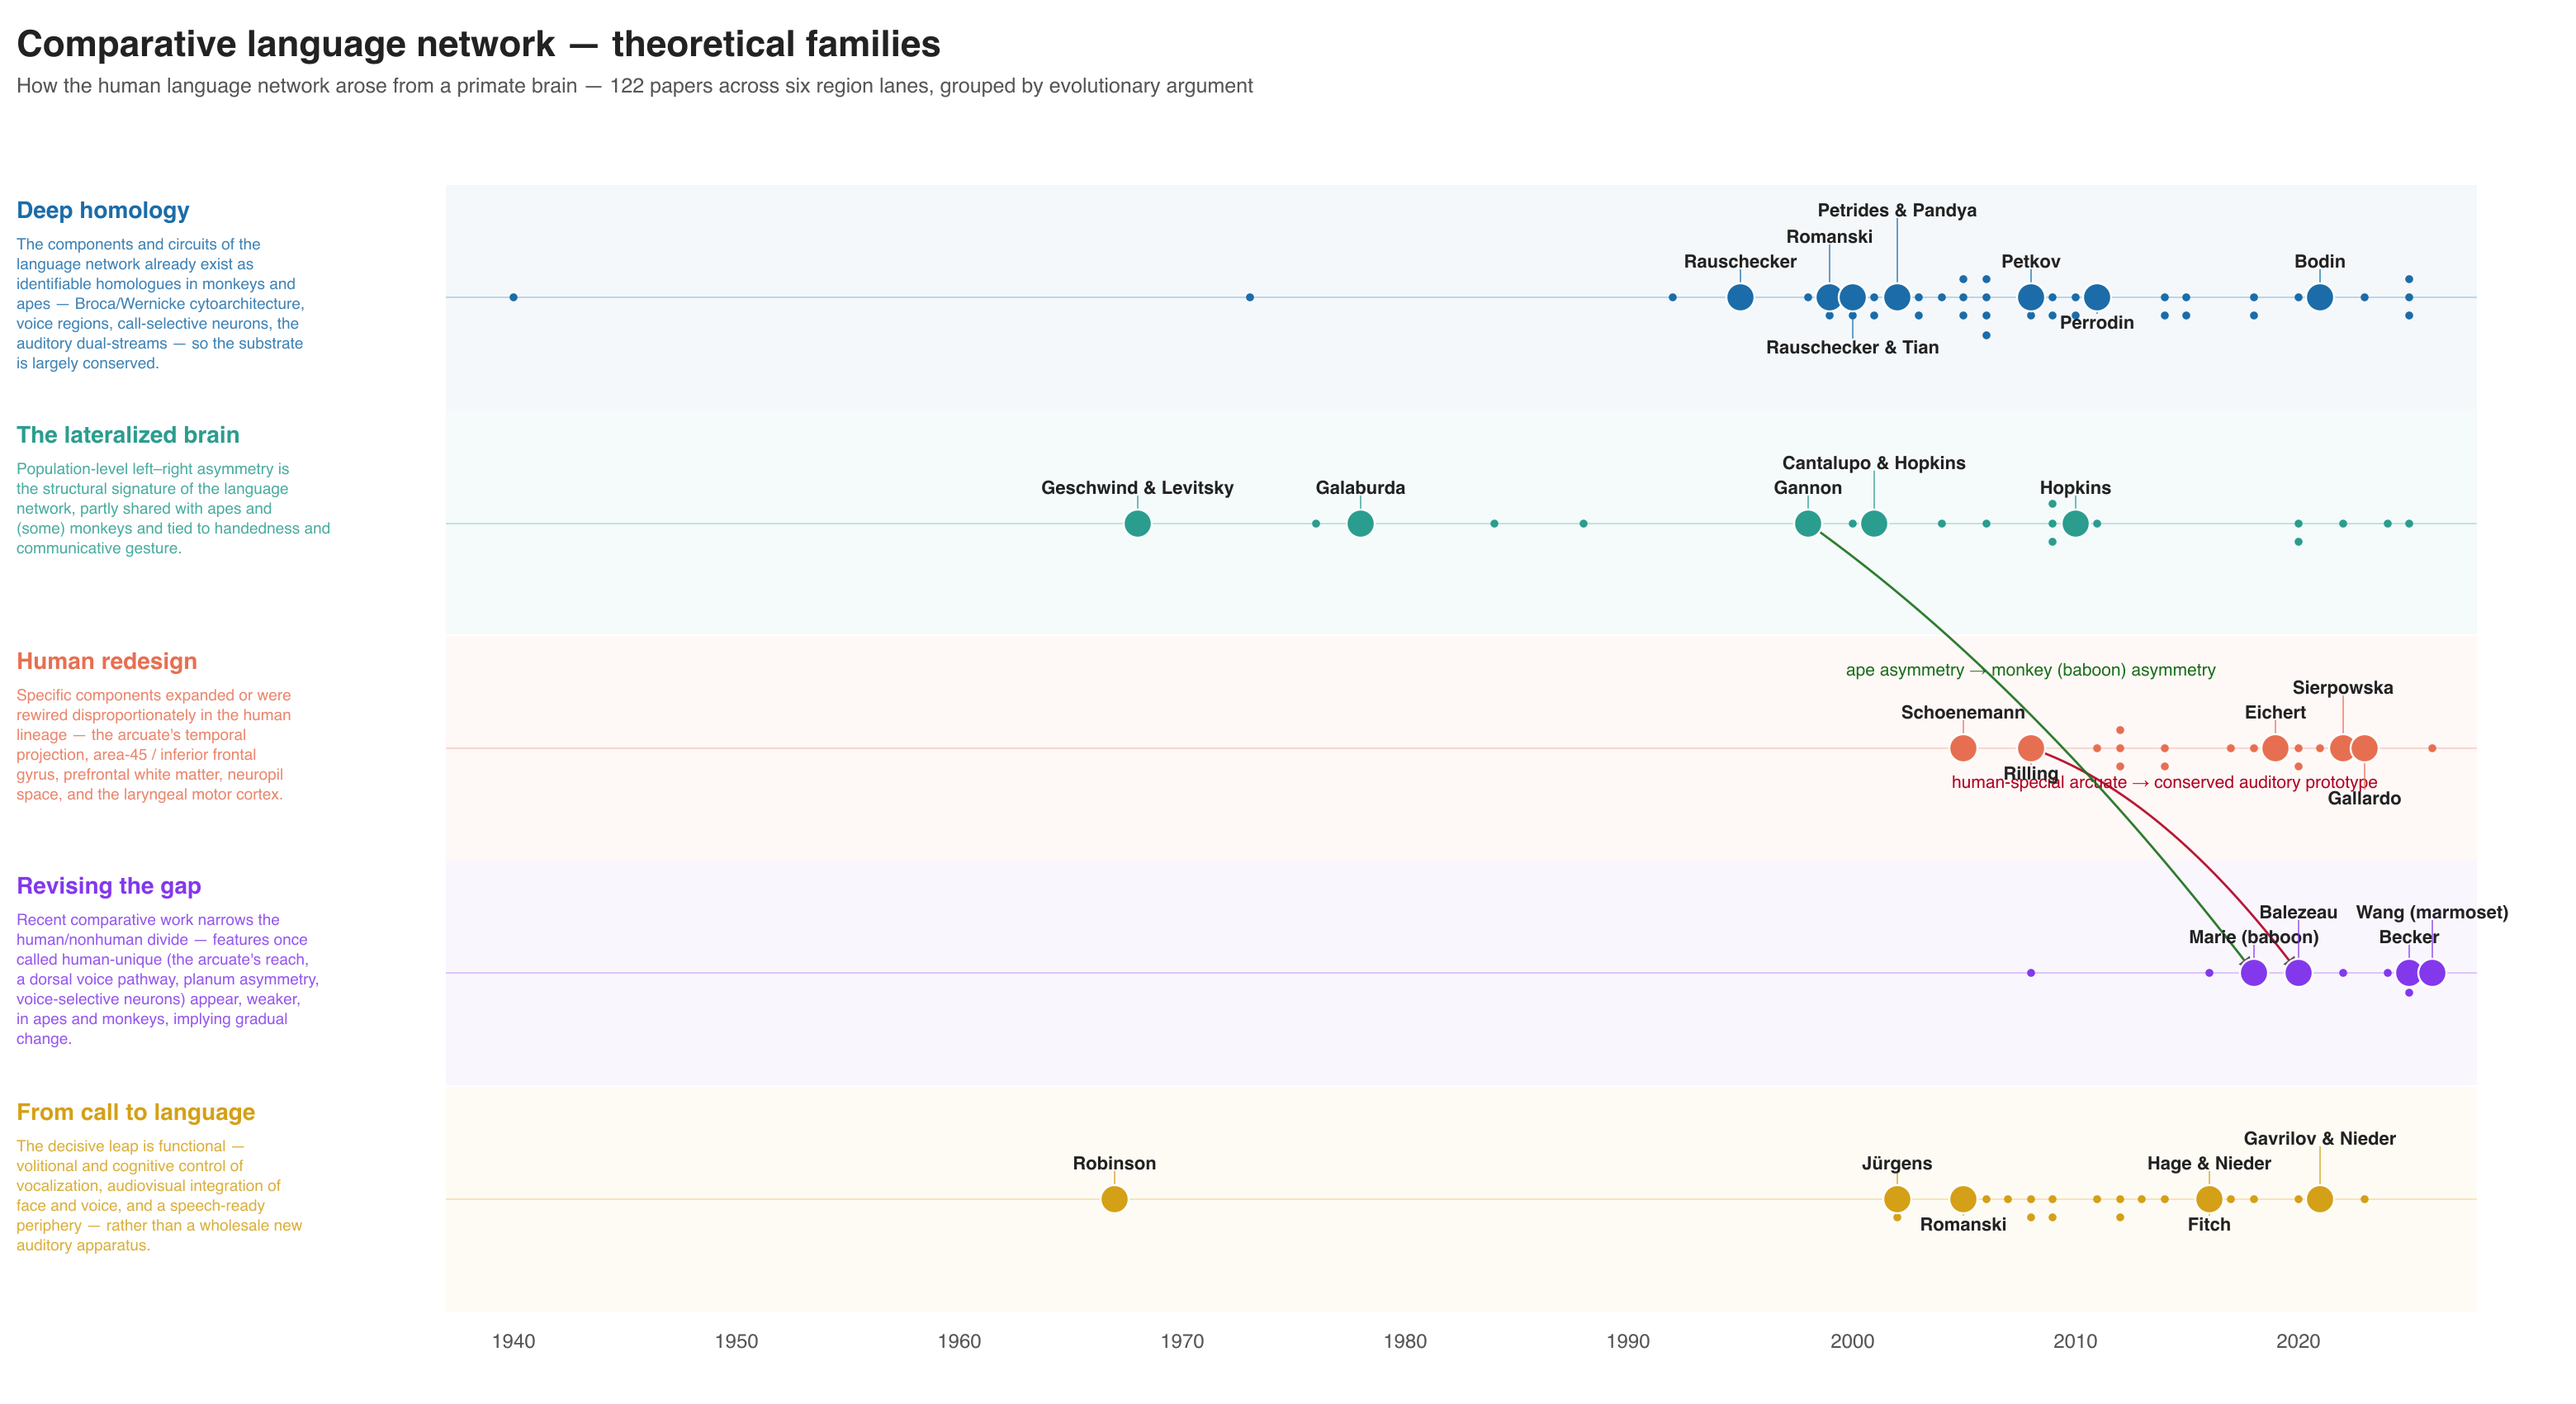
Five arguments for how language arose from a primate brain. 122 papers, 1940–2026. The two arrows were added by hand: each links an old claim that a feature is uniquely human to a recent paper that found it in monkeys. Every paper in the "revising the gap" lane dates from 2008 or later.
Brain recordings during conversation
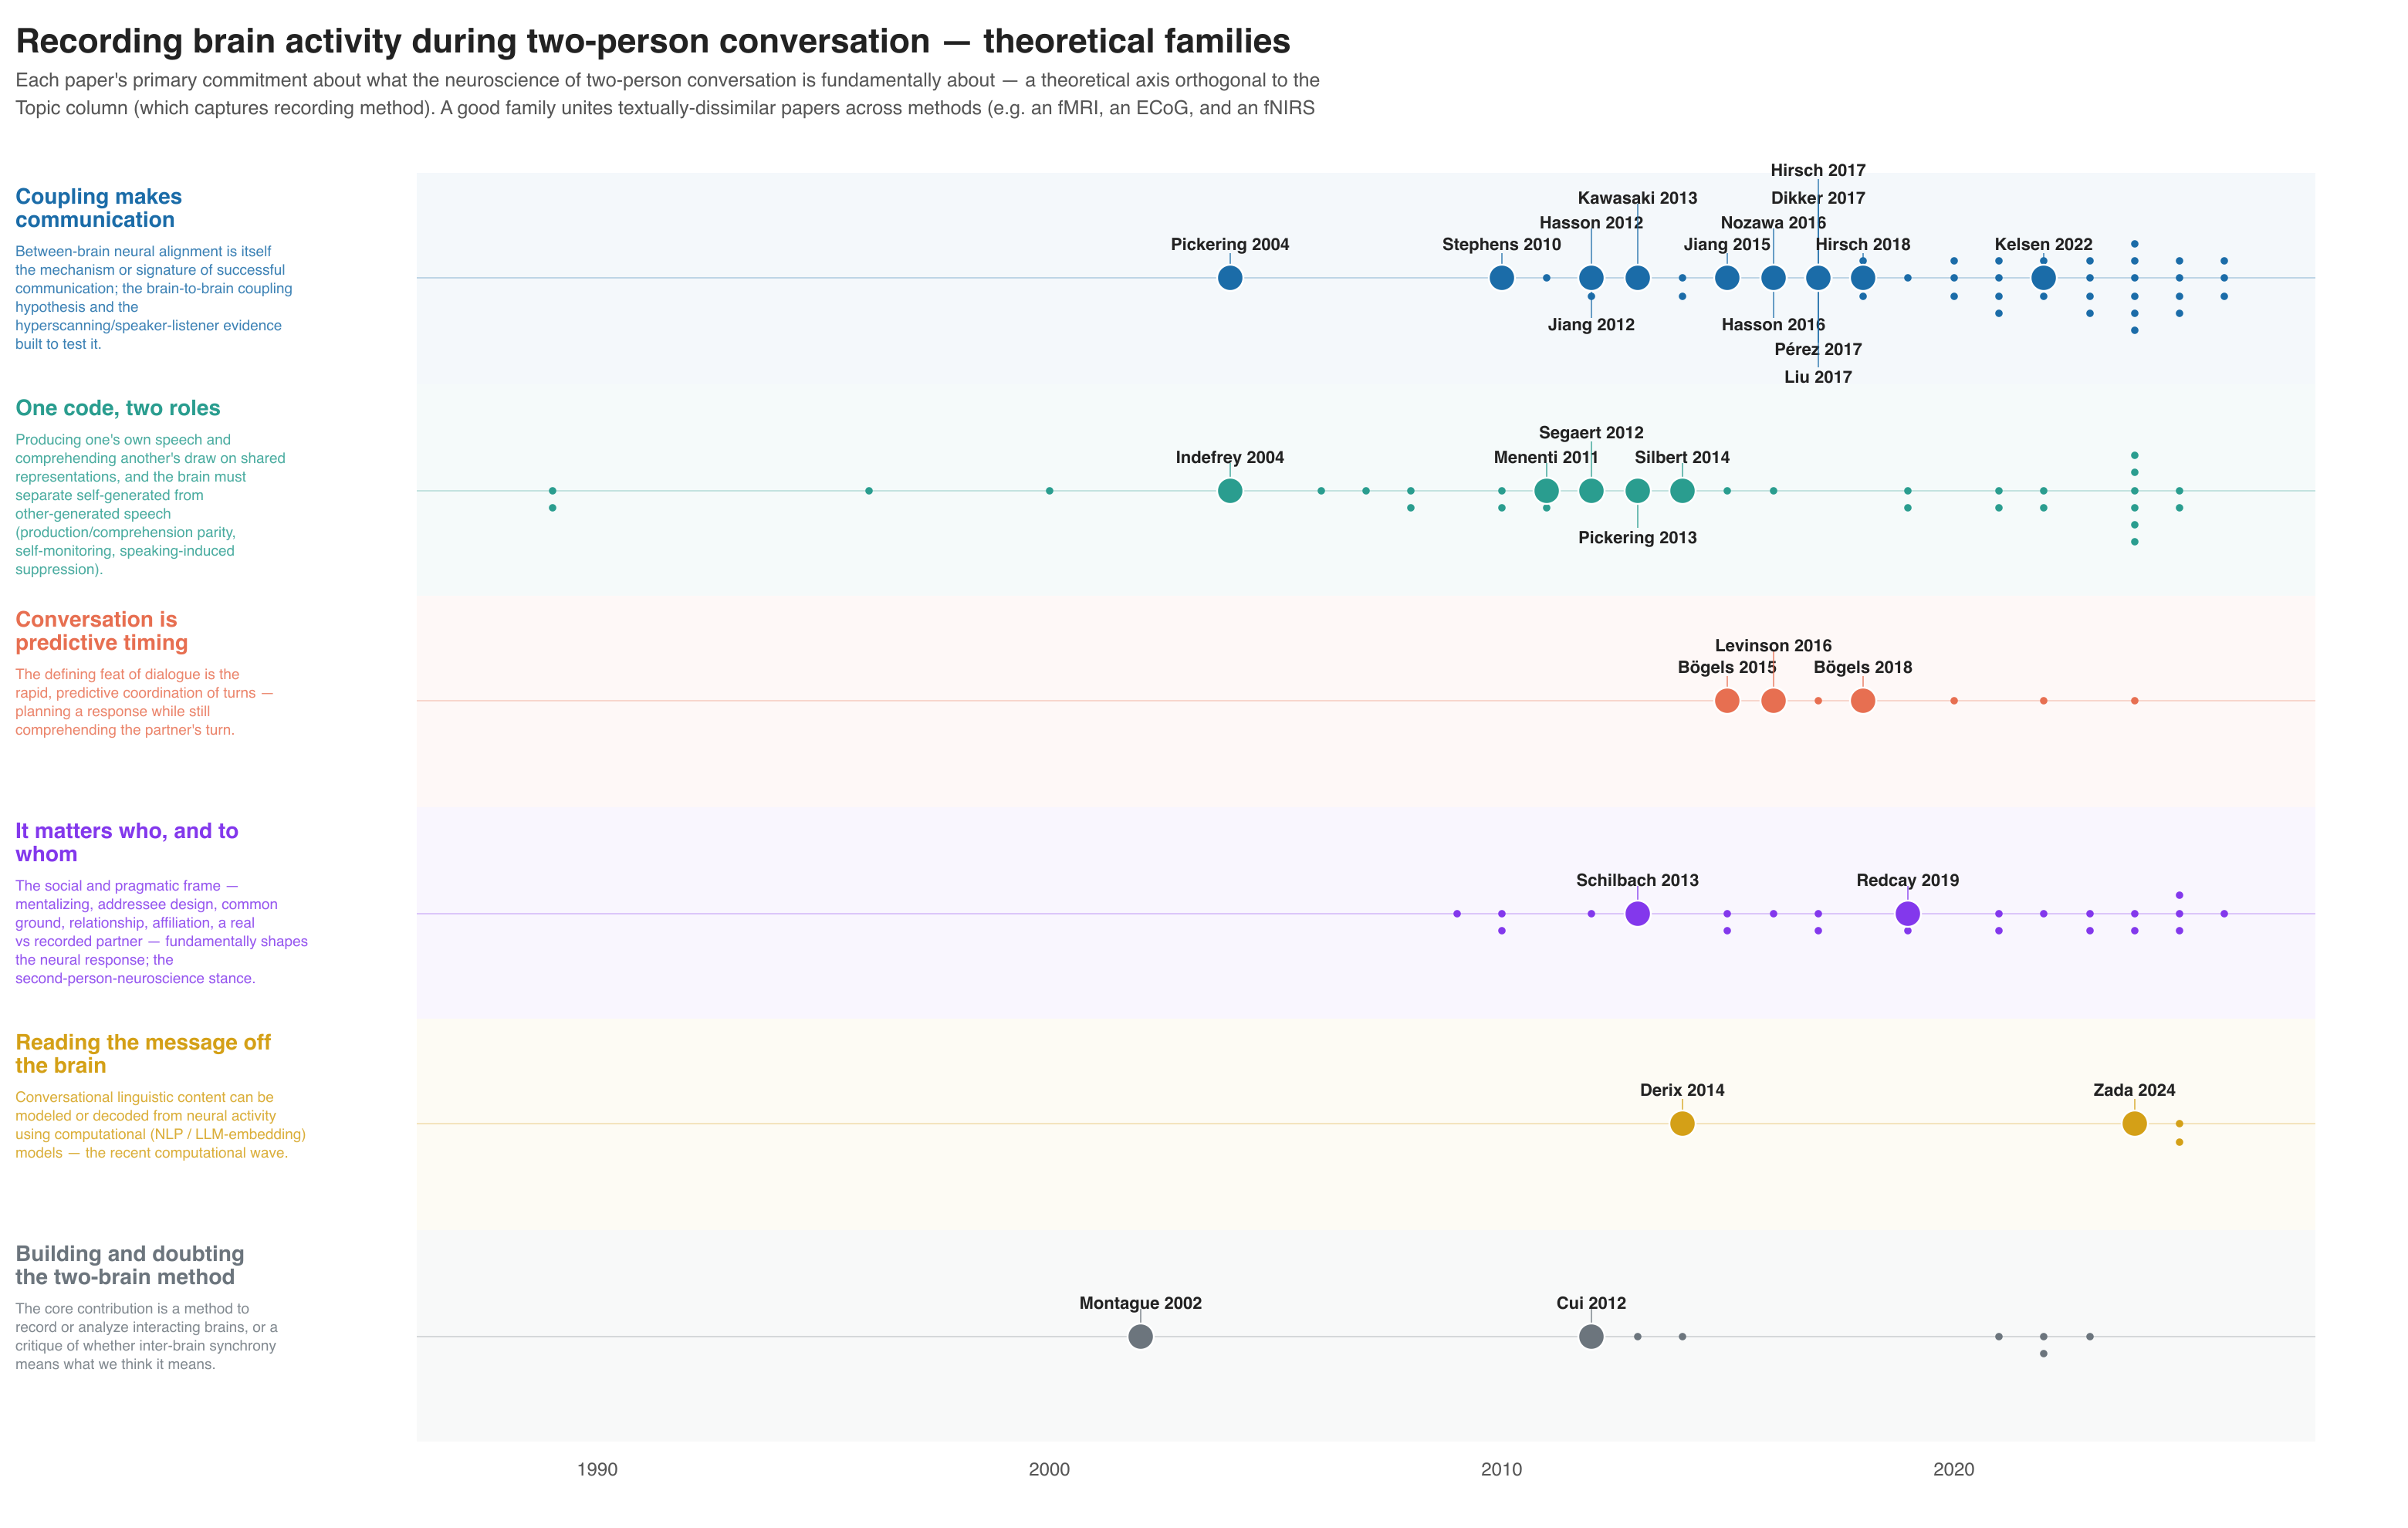
Six views of what the neuroscience of dialogue studies. 131 papers, 1989–2025. Coupling between two brains, shared codes for speaking and listening, turn timing, social context, decoding the message, and recording two brains at once. Nearly all of it is from after 2004, and the decoding lane holds only four papers.
A lab review
A lab review starts from one lab's publications instead of a question. It groups the lab's work into themes, then searches outward to place each theme in its field. This one began with the request "review the Gallant lab's human-imaging work in the context of the broader field."
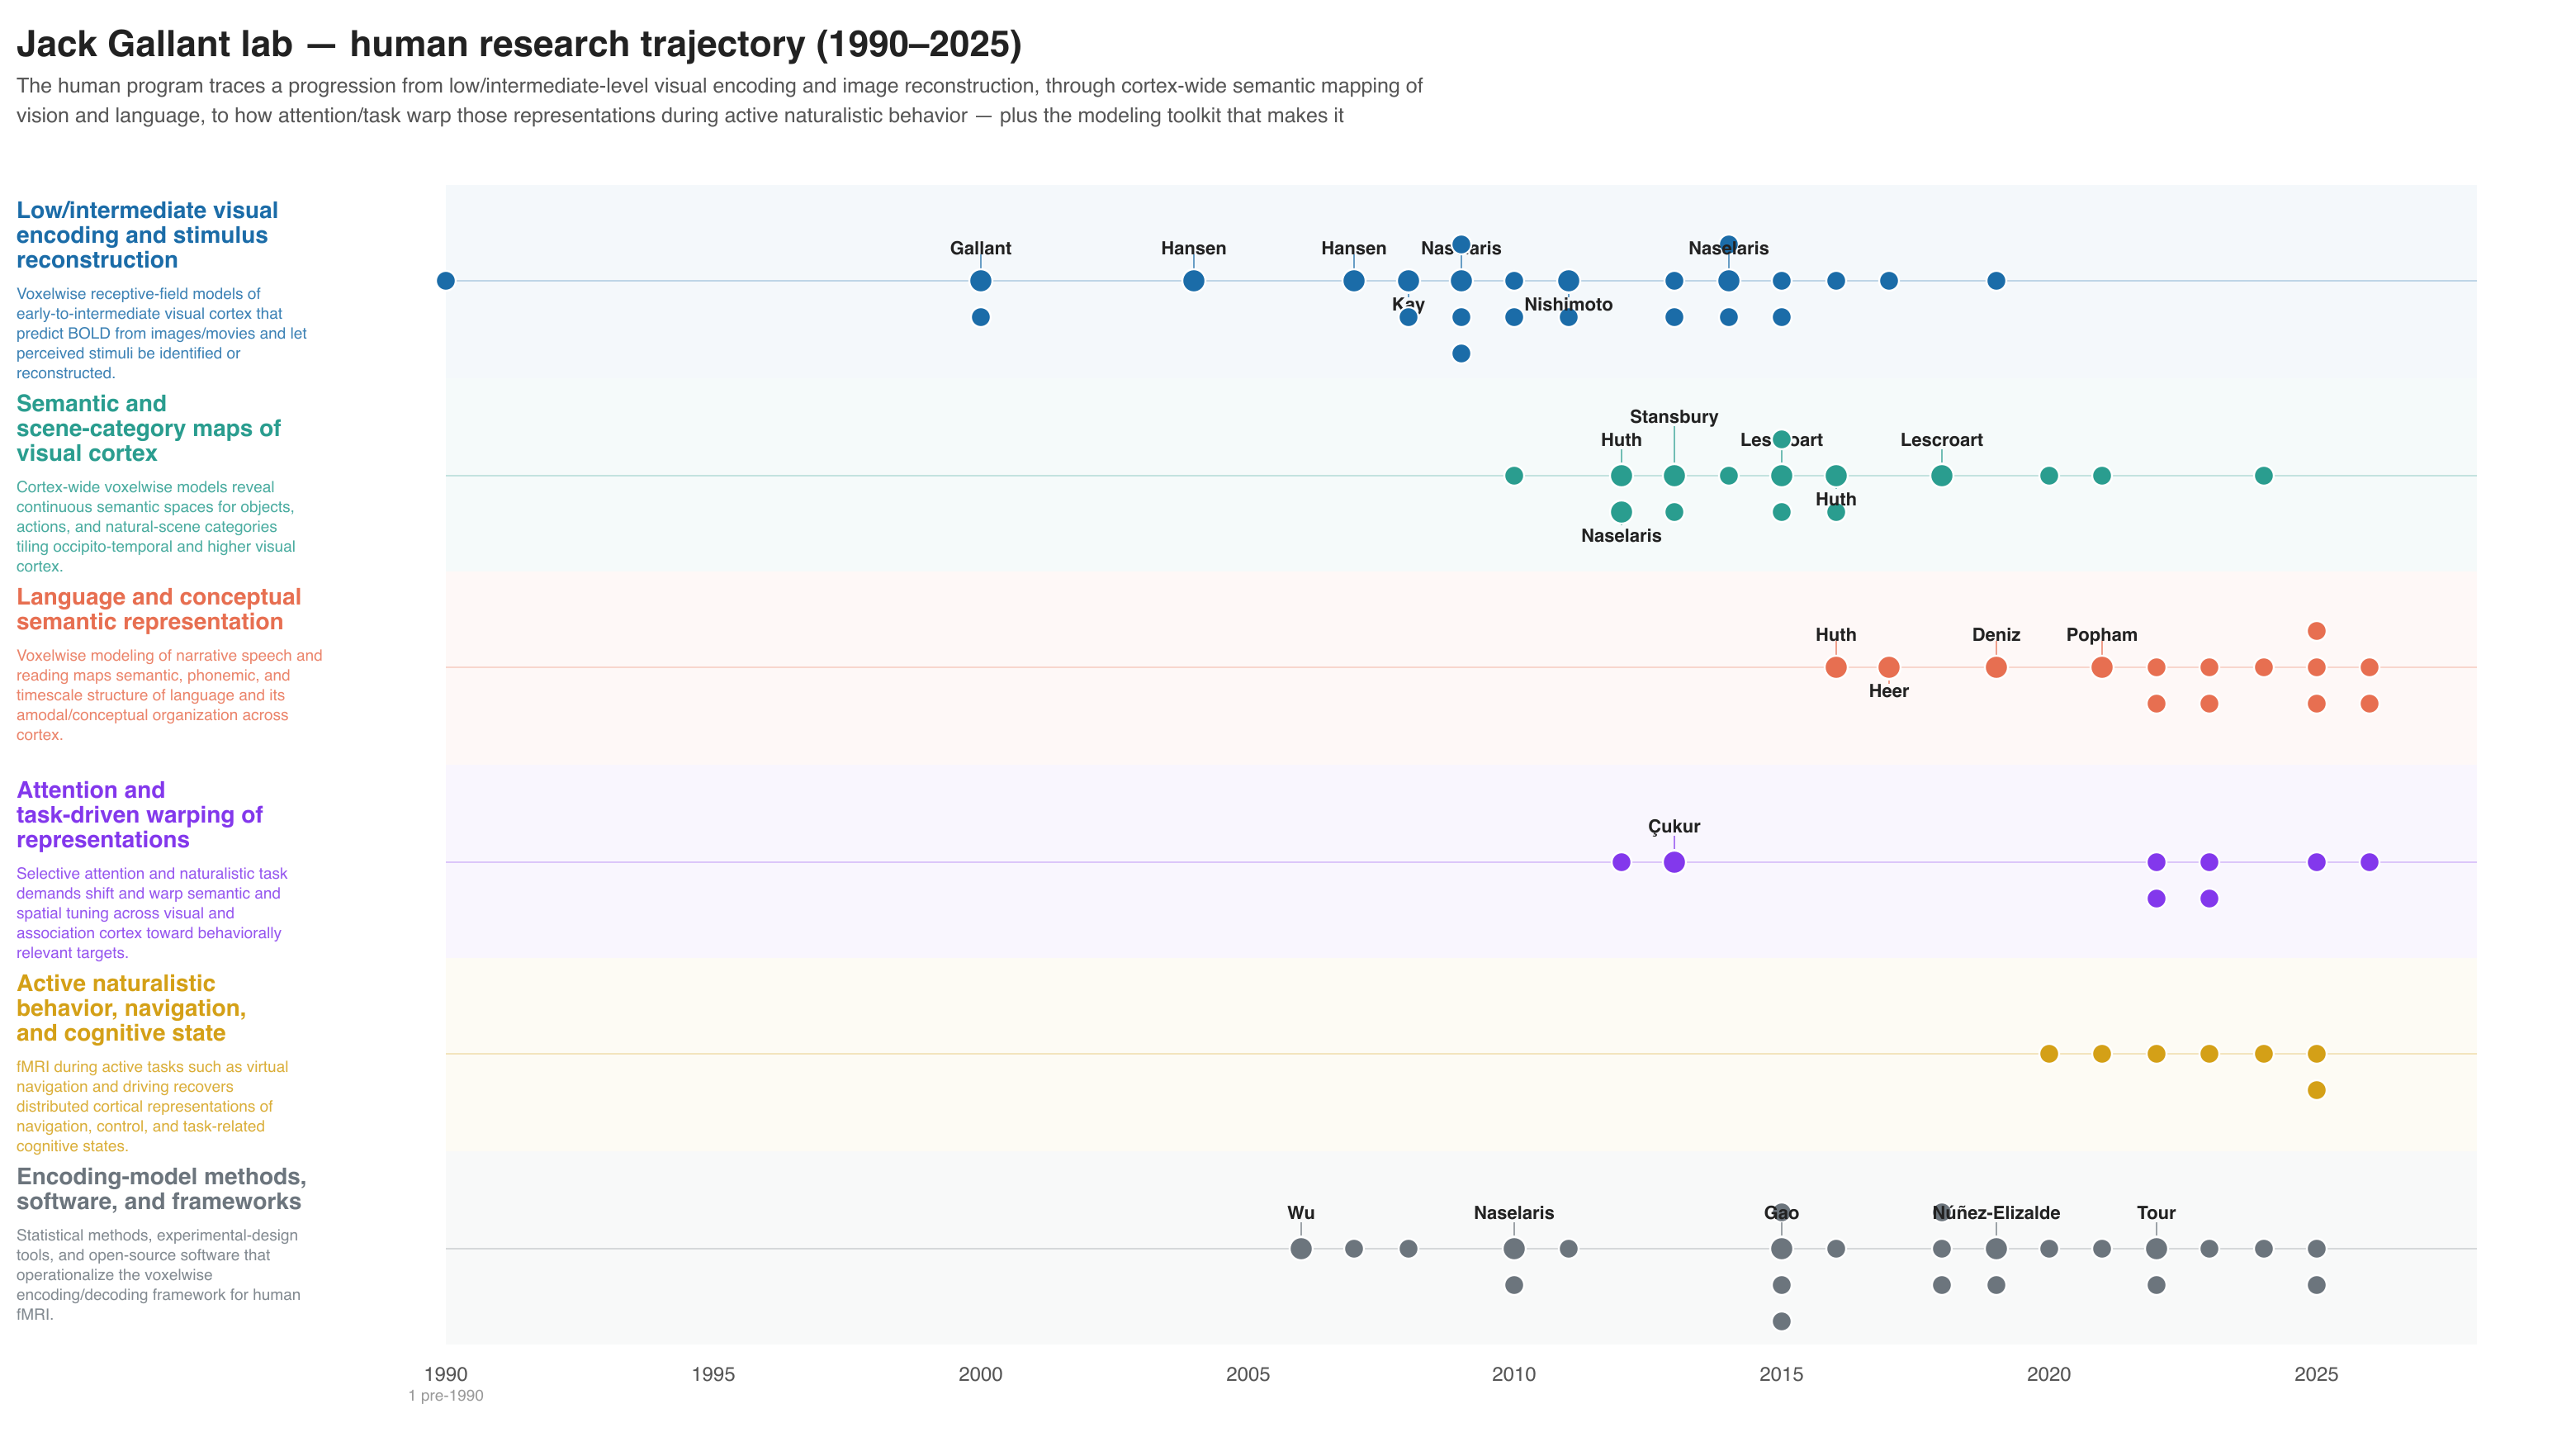
First, the lab's own work. 61 human-imaging papers from the Gallant lab, 1990–2025, in six themes. Every dot is a lab paper, so every dot carries a star. The work moves from visual encoding (2000–2015) to meaning in visual cortex (from 2012) and then to language (from 2016).
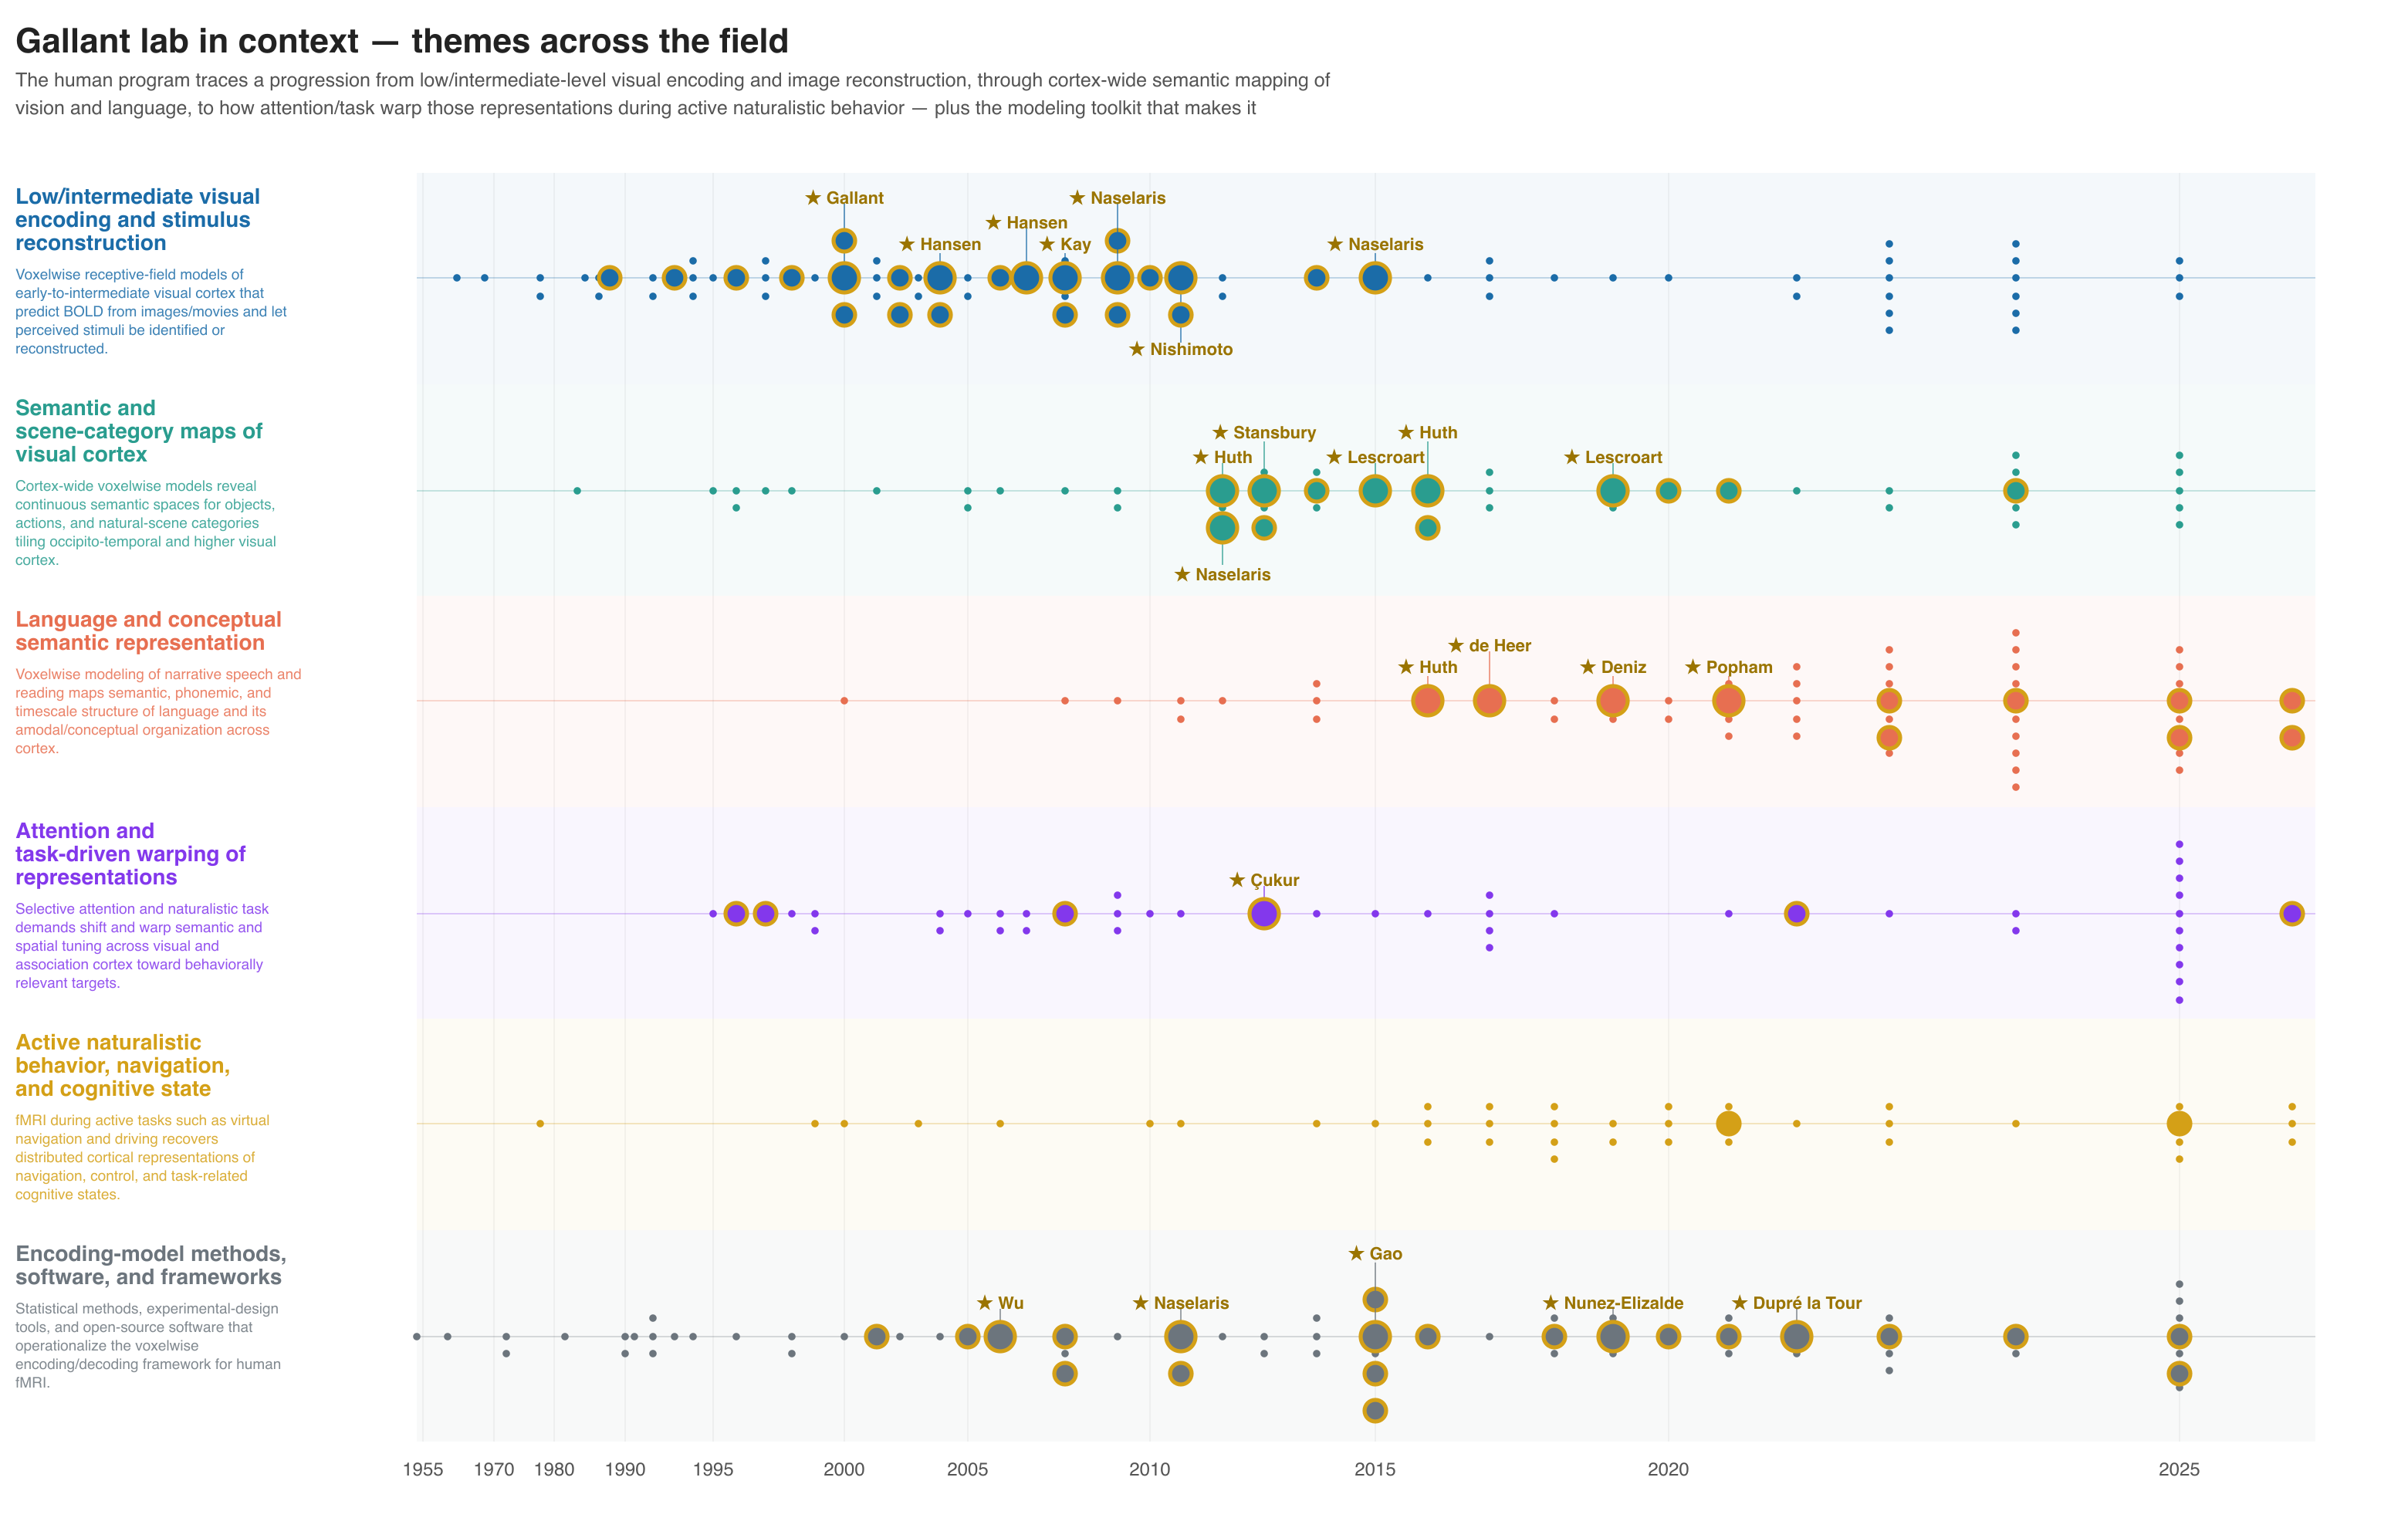
Then, the same themes in their fields. 287 papers from other groups added around 72 lab papers, 359 in all. Starred dots are the lab's. In visual encoding, the lab's papers sit inside a literature that began decades earlier; in language, most of the field's papers came after the lab's 2016 landmark.
A written review
When you ask for one, the agent drafts a written review from the papers' abstracts. These pages come from the review of how the brain represents complexity.
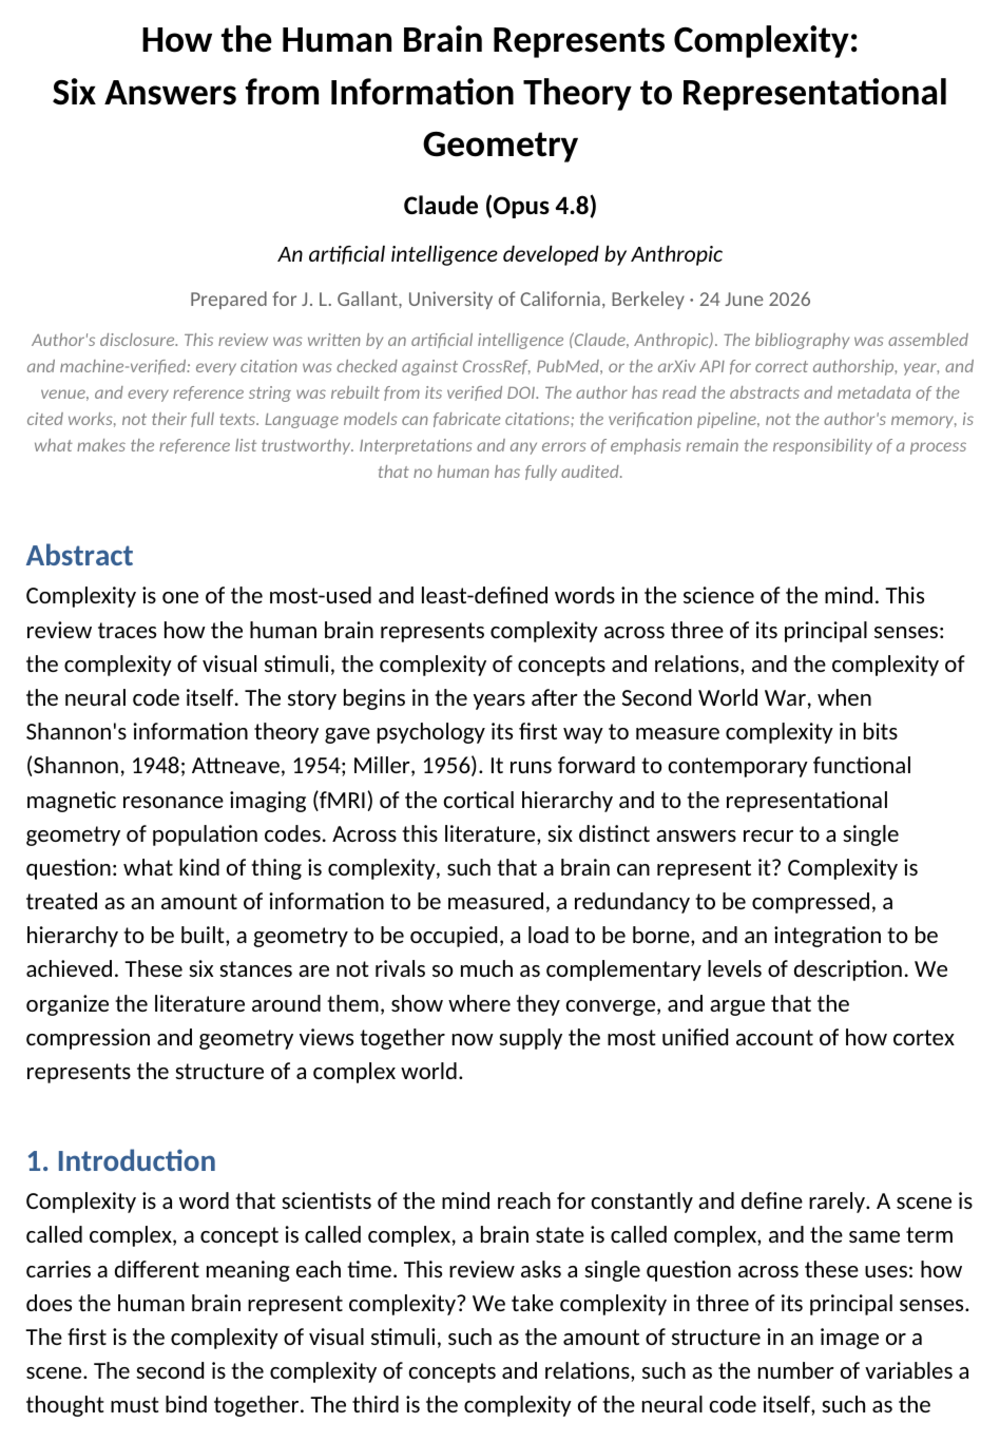
The title page says who wrote the review and how it was checked. The author block names the AI model. The disclosure says every citation was checked by machine, every reference was rebuilt from its DOI, and the summaries come from abstracts, not full texts.
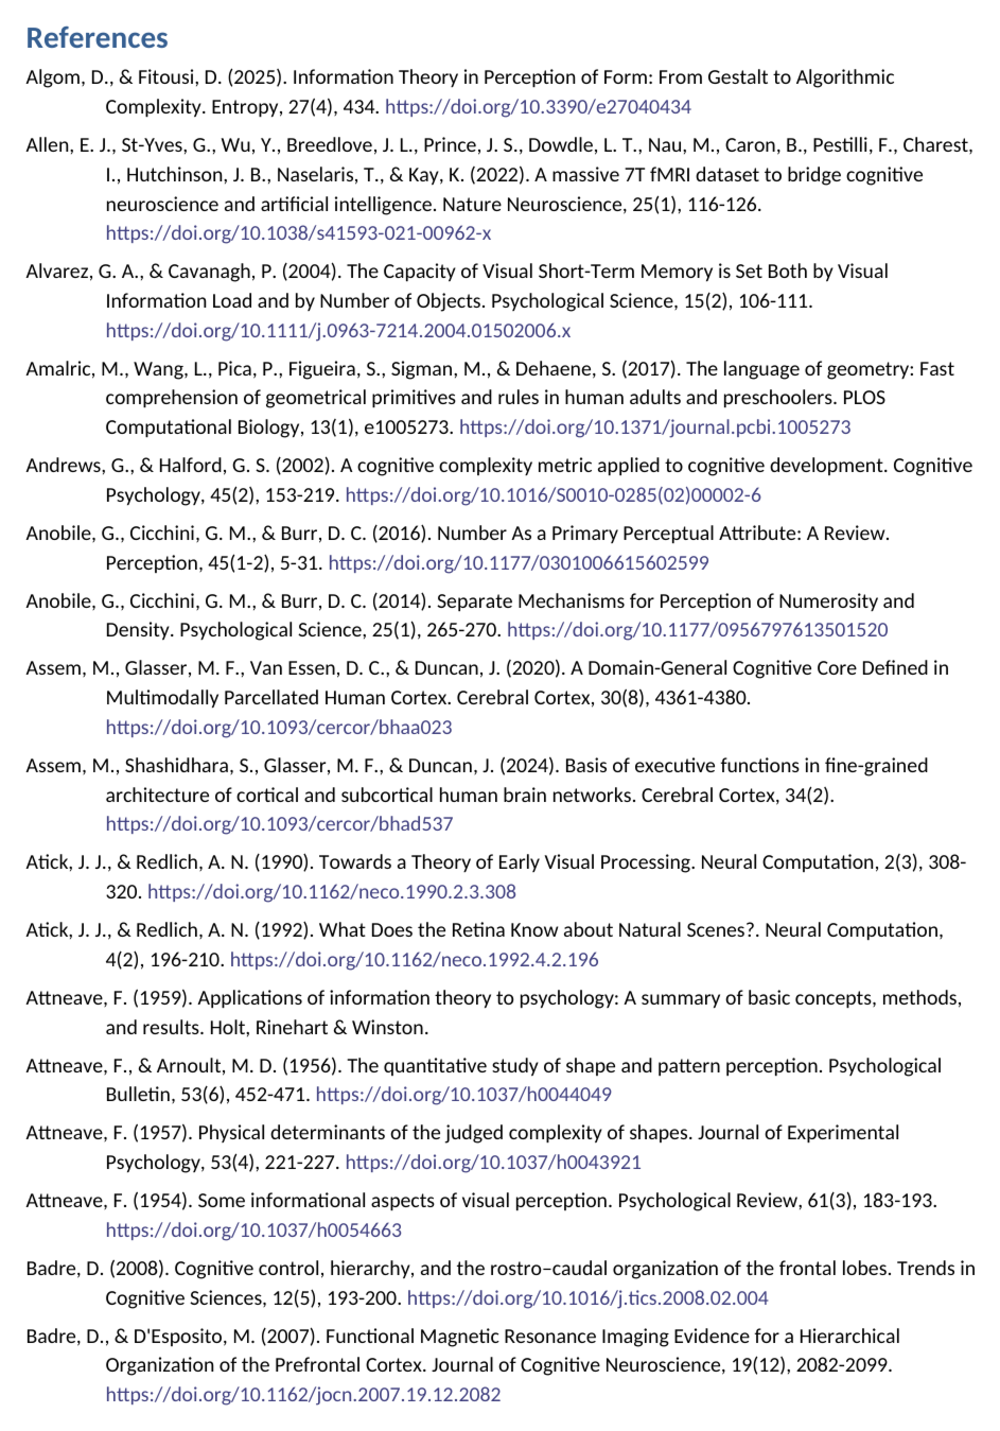
The reference list is generated from the checked papers, not typed. Each entry has its full author list, its title in sentence case and a DOI link, in APA order. The one entry without a link is a book with no DOI.