Brain Viewers
This page collects public brain viewers that you can use to interact with the data and results from many of our published studies. To reach the brain viewer for any topic, just click on the highlighted hyperlink. Please note that these brain viewers do not run well on cell phones, you will have the best experience with a computer or a tablet.
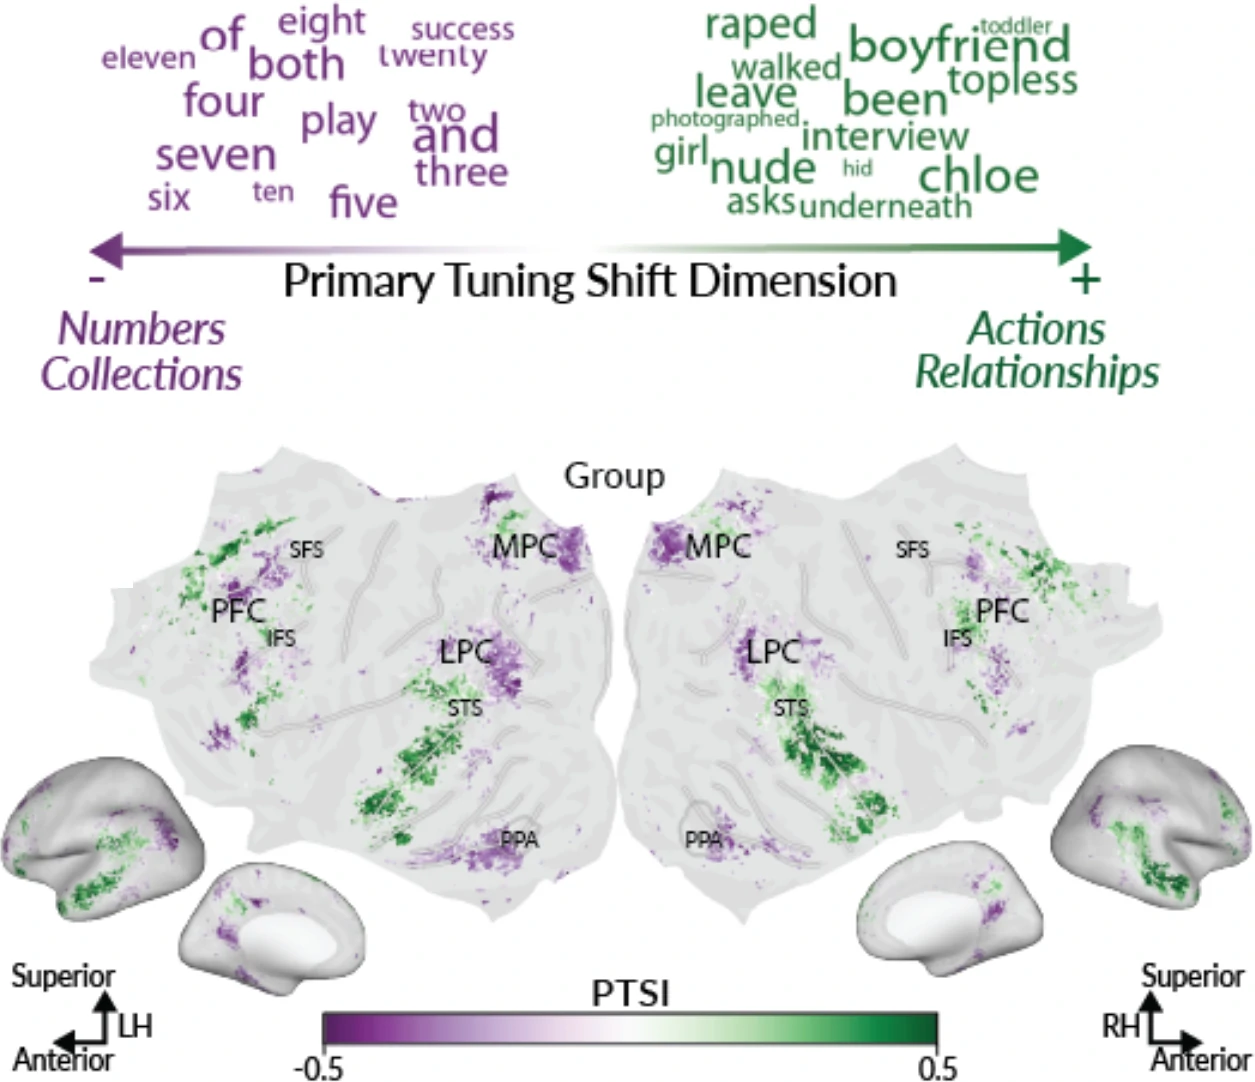
Bilingual language processing relies on shared semantic representations that are modulated by each language (Chen et al., bioRxiv preprint, 2024)
Billions of people throughout the world are bilingual and can extract meaning from multiple languages. To determine how semantic representations in the brains of bilinguals can support both shared and distinct processing for different languages, we performed fMRI scans of participants who are fluent in both English and Chinese while they read natural narratives in each language. This brain viewer allows you to explore, compare and contrast English and Chinese semantic representations in one bilingual participant.
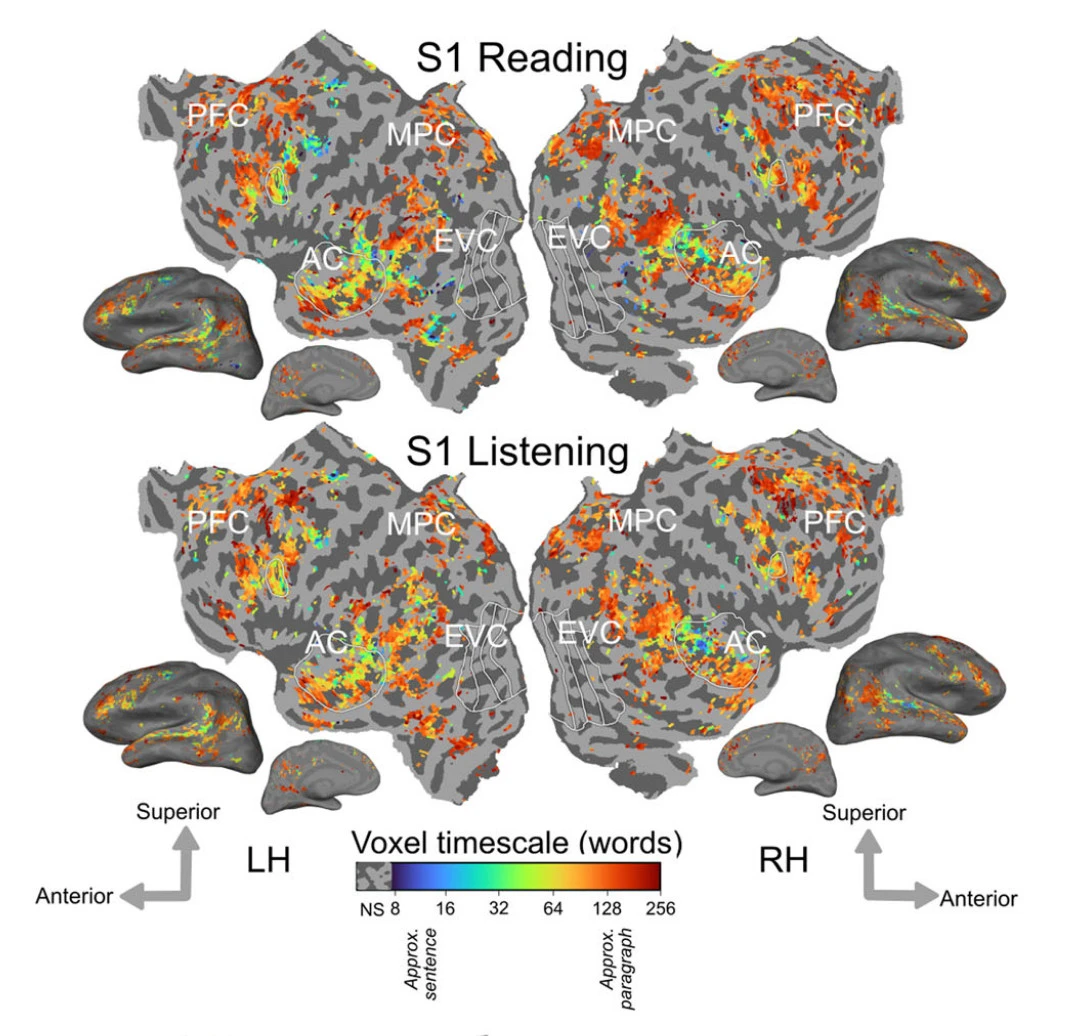
The cortical representation of language timescales is shared between reading and listening (Chen et al., Communications Biology, 2024)
Language comprehension involves integrating low-level sensory inputs into a hierarchy of increasingly high-level features. To recover this hierarchy we mapped the intrinsic timescale of language representation across the cerebral cortex during listening and reading. We find that the timescale of representation is organized similarly for the two modalities. The interactive brain viewer shows how the timescales of language representation change systematically across the cortical surface. The colors on the cortical map indicate the context length for language representation.
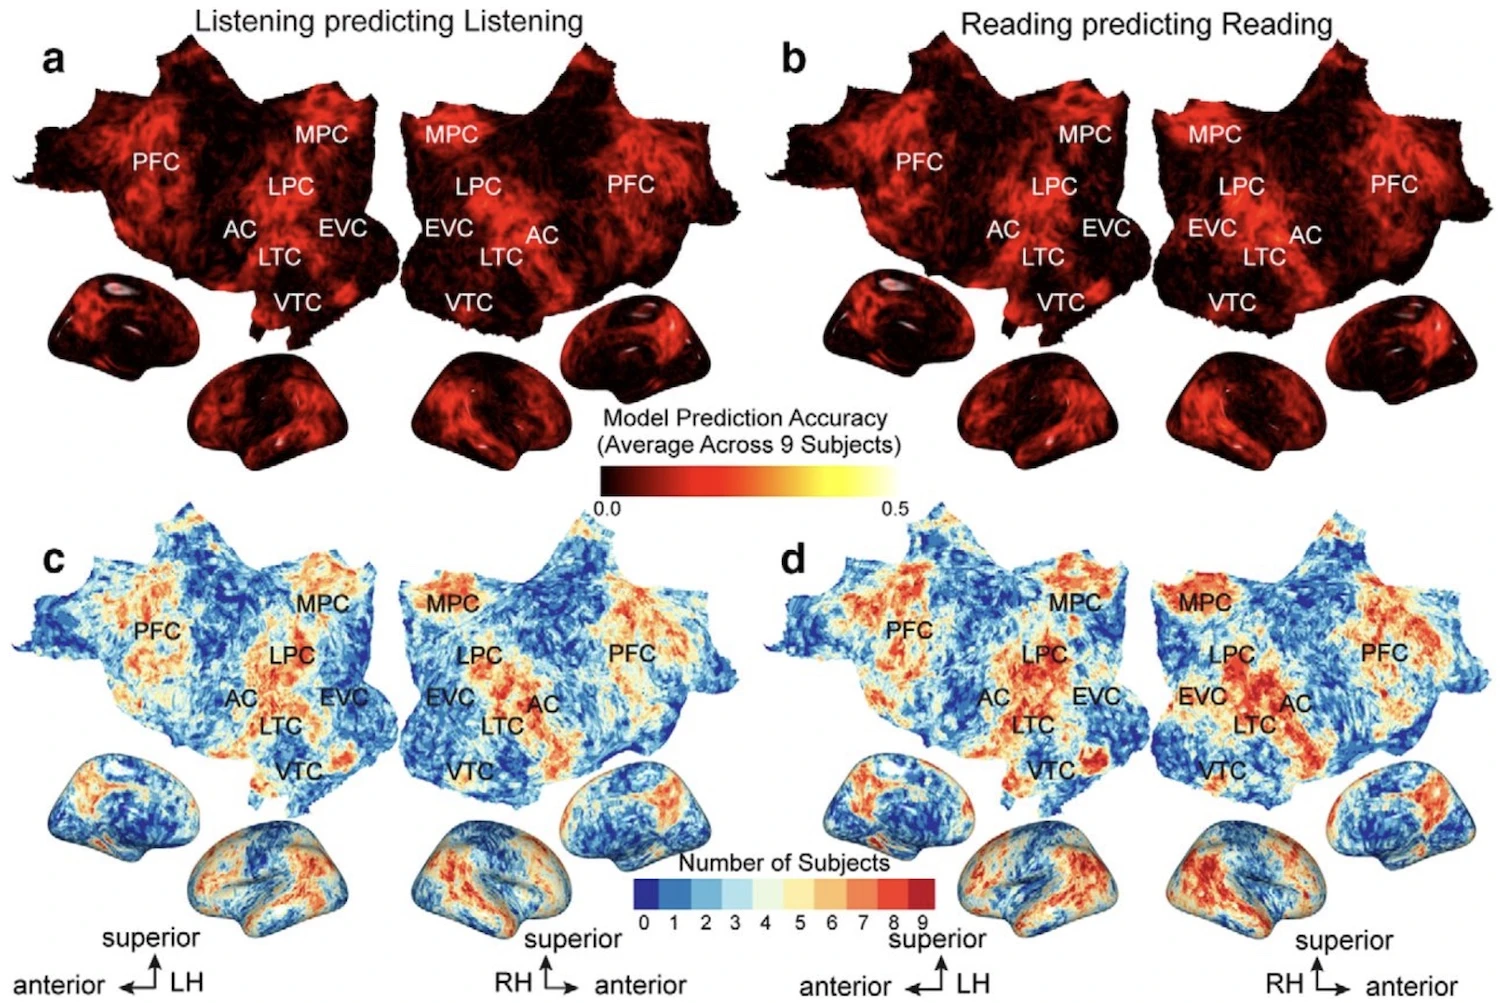
The representation of semantic information across human cerebral cortex during listening versus reading is invariant to stimulus modality (Deniz et al., J. Neuroscience, 2019)
In this experiment, people listened to and read stories from the Moth Radio Hour while brain activity was recorded. Voxelwise modeling was used to determine how each individual brain location responded to semantic concepts in the stories during listening and reading, separately. The interactive brain viewer shows how these concepts are mapped across the cortical surface for both modalities (listening and reading). The colors on the cortical map indicate the semantic concepts that will elicit brain activity at that location during listening and reading.
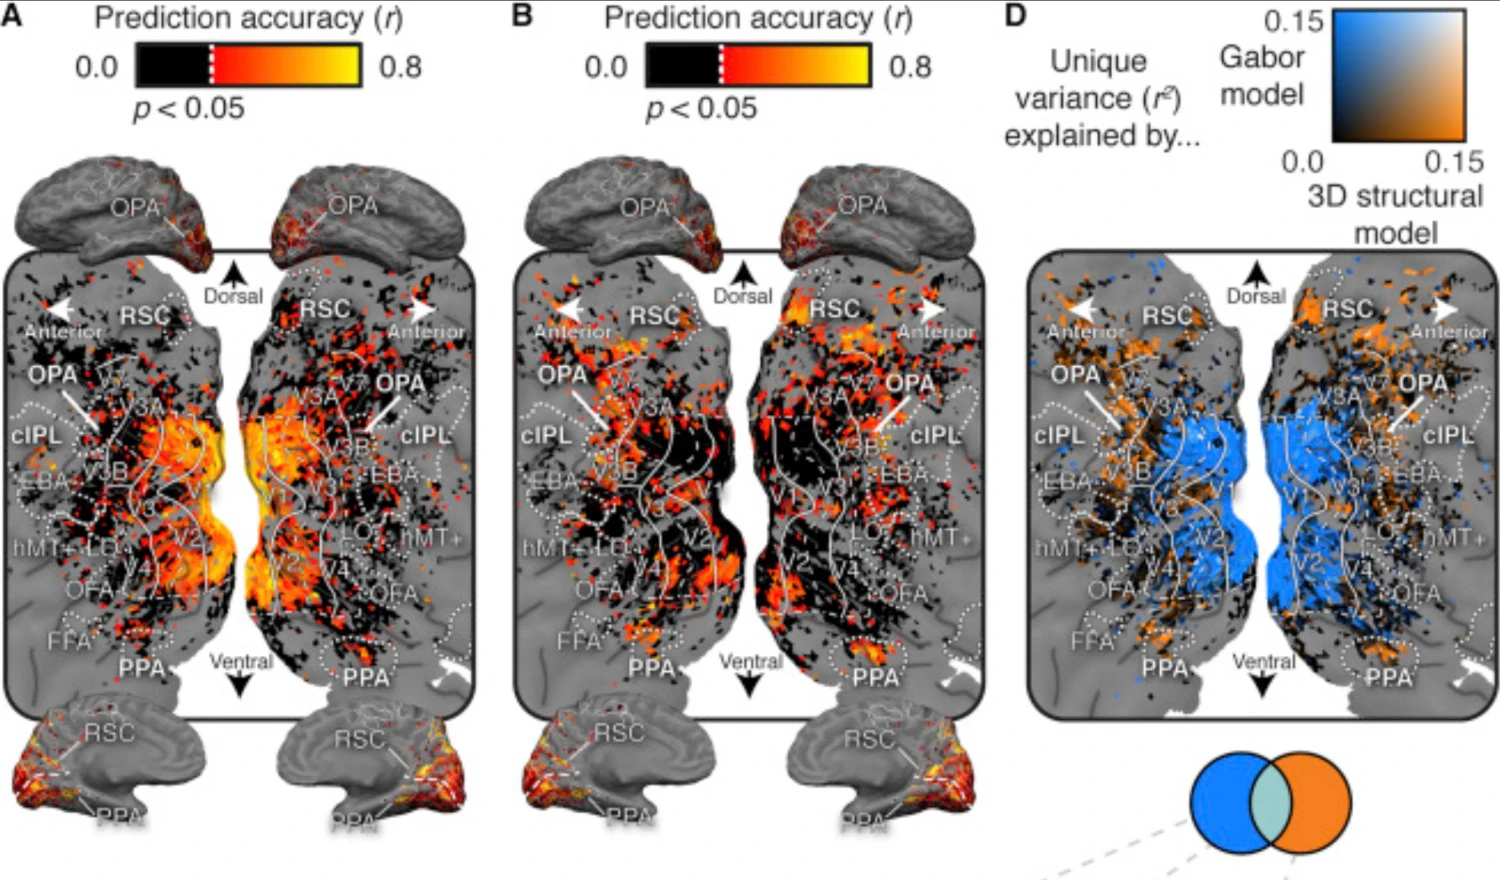
Human scene-selective areas represent the 3D configuration of surfaces (Lescroart et al., Neuron, 2018)
In this experiment people viewed rendered animations depicting objects placed in scenes. The MRI data were analyzed by voxelwise modeling to recover the cortical representation of low-level features and 3D structure. This demo shows how surface position, distance and orientation are mapped across the cortical surface.
Natural speech reveals the semantic maps that tile human cerebral cortex (Huth et al., Nature, 2016)
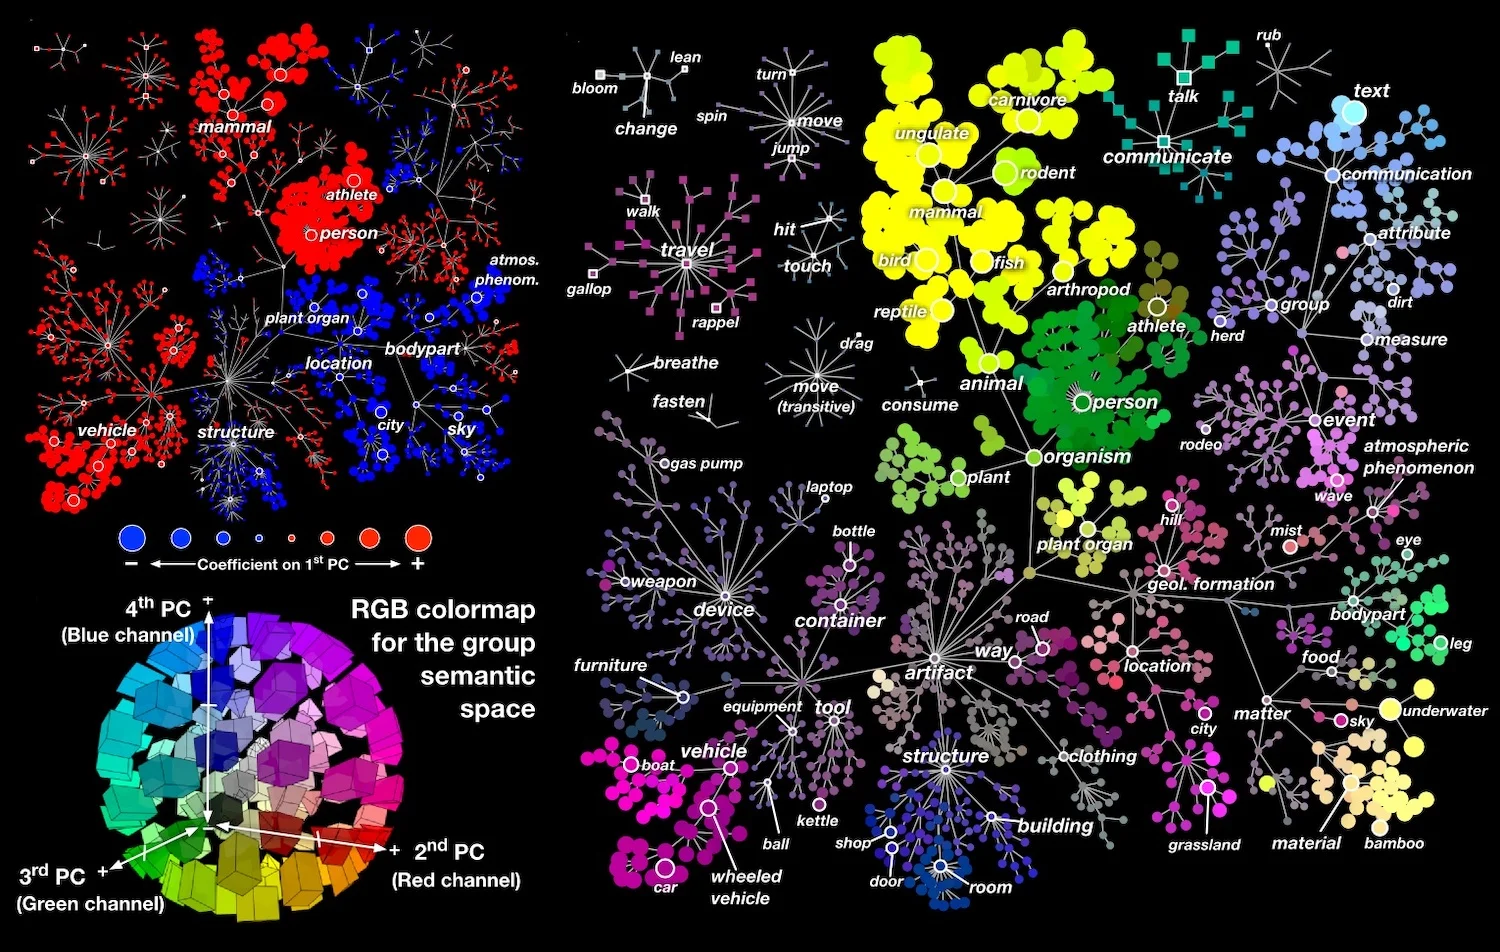
In this experiment people passively listened to stories from the Moth Radio Hour while brain activity was recorded. Voxelwise modeling was used to determine how each individual brain location responded to 985 distinct semantic concepts in the stories. The demo shows how these concepts are mapped across the cortical surface. The colors on the cortical map show indicate the semantic concepts that will elicit brain activity at that location. The word cloud at right shows words that the model predicts would evoke the largest brain response at the indicated location. Follow the tutorial at upper right to find out more about this tool.
Attention during natural vision warps semantic representations across the human brain (Cukur et al., Nature Neuroscience, 2013)
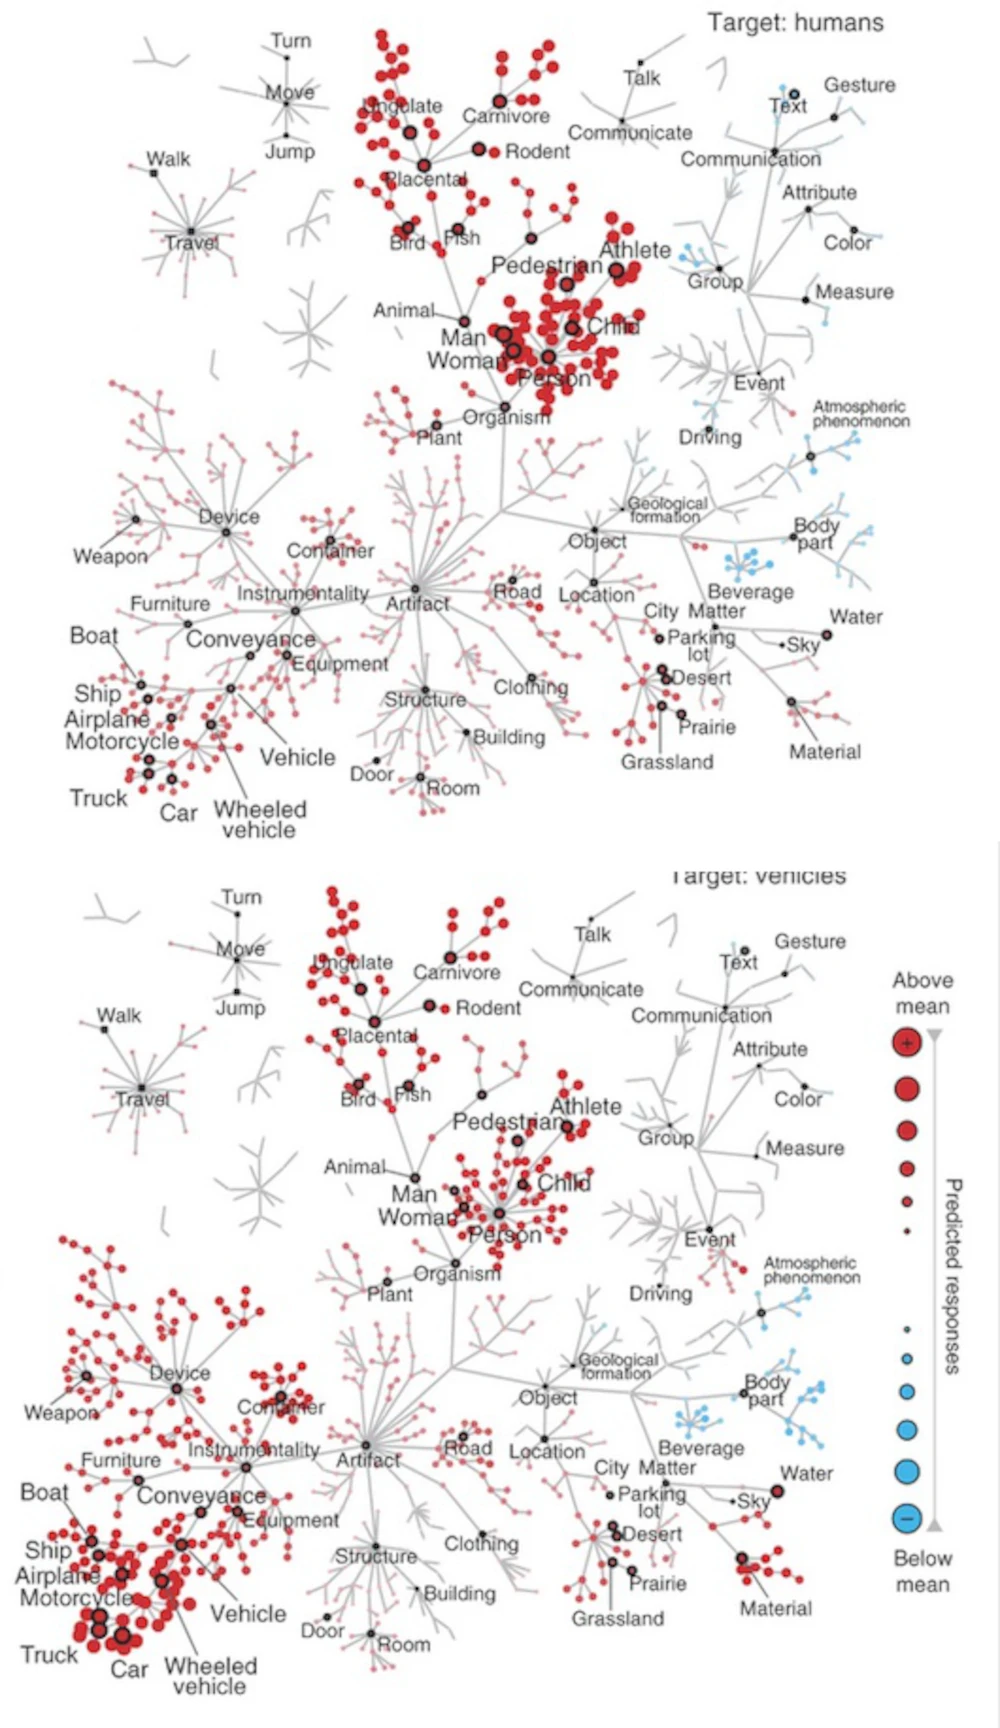
In this experiment people passively watched movies while monitoring for the presence of either "humans" or "vehicles", and in a neutral condition. Voxelwise modeling was used to determine how each brain location responded to 985 distinct categories of objects and actions in the movies, and how these responses were modulated by attention. This brain viewer allows you to view data collected under the three different conditions (left click "Passive Viewing", "Attending to Humans" or "Attending to Vehicles"). By selecting single brain locations (left click on the brain) or single categories (left click on the WordNet tree), you can see how tuning changes under different states of attention.
Group-based language comprehension semantic map viewer
In 2016 we published a paper that used fMRI, a language comprehension experiment, and voxelwise encoding models to map lexical semantic concepts across the cortical surface. We released brain viewer for that study (see above on this page), but that viewer only showed data from one participant. This viewer provides a way to inspect cortical lexical-semantic conceptual maps at the group level, vertex-by-vertex. The data for this viewer were generated by pooling lexical semantic maps from 24 separate participants who listened to several hours of natural narrative stories. Based on the results that we reported in another recent paper, this viewer should account for about 80% of the variance in lexical semantic conceptual maps in any individual. Please note that although this viewer is usable, it is still in development. In the coming weeks the viewer interface will improve and more documentation will be provided.
Group-based short movie clip semantic map viewer
In 2012 we published a paper that used fMRI, a short movie clip viewing experiment, and voxelwise encoding models to map visual semantic concepts across the cortical surface. We released brain viewer for that study (see above on this page), but that viewer only showed data from one participant. This viewer provides a way to inspect cortical visual-semantic conceptual maps at the group level, vertex-by-vertex. The data for this viewer were generated by pooling visual semantic maps from 15 separate participants who watched several hours of short movie clips. Please note that although this viewer is usable, it is still in development. In the coming weeks the viewer interface will improve and more documentation will be provided.
Cortical anatomy viewer
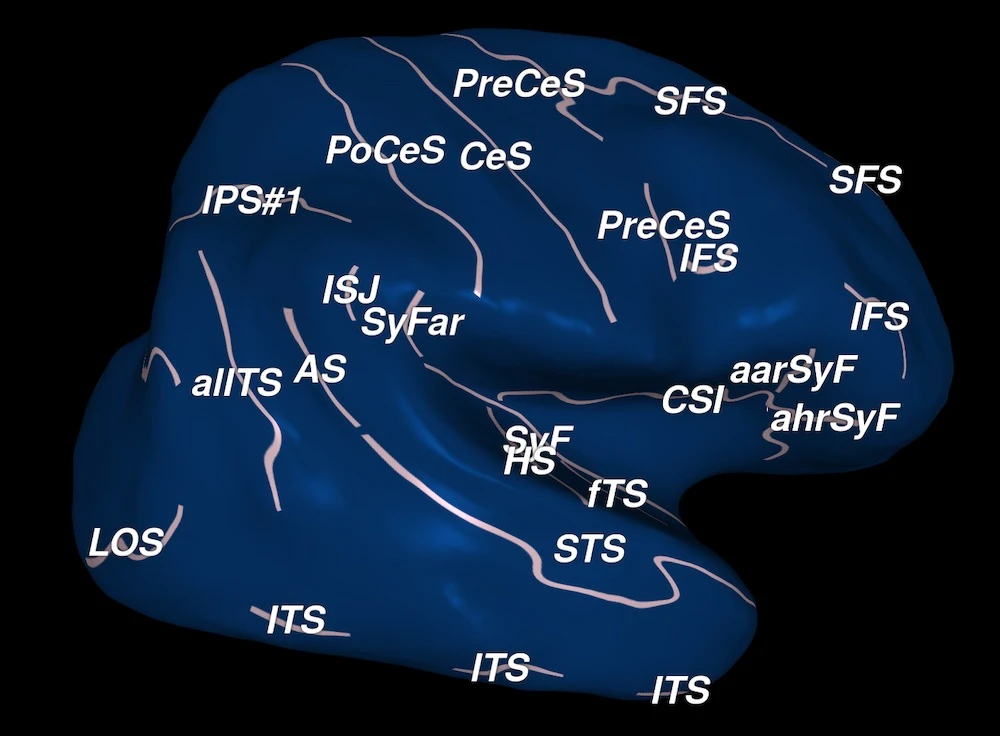
In order to be able to visualize the complete cortical surface, neuroscientists often work with inflated or flattened cortical maps. However, it can be difficult to orient oneself correctly when inspecting these maps. This viewer provides labels for many of the most commonly referenced sulci and gyri. By switching between folded, inflated and flattened views one can get a good sense of how important cortical landmarks vary across these different views.
Retinotopy viewer
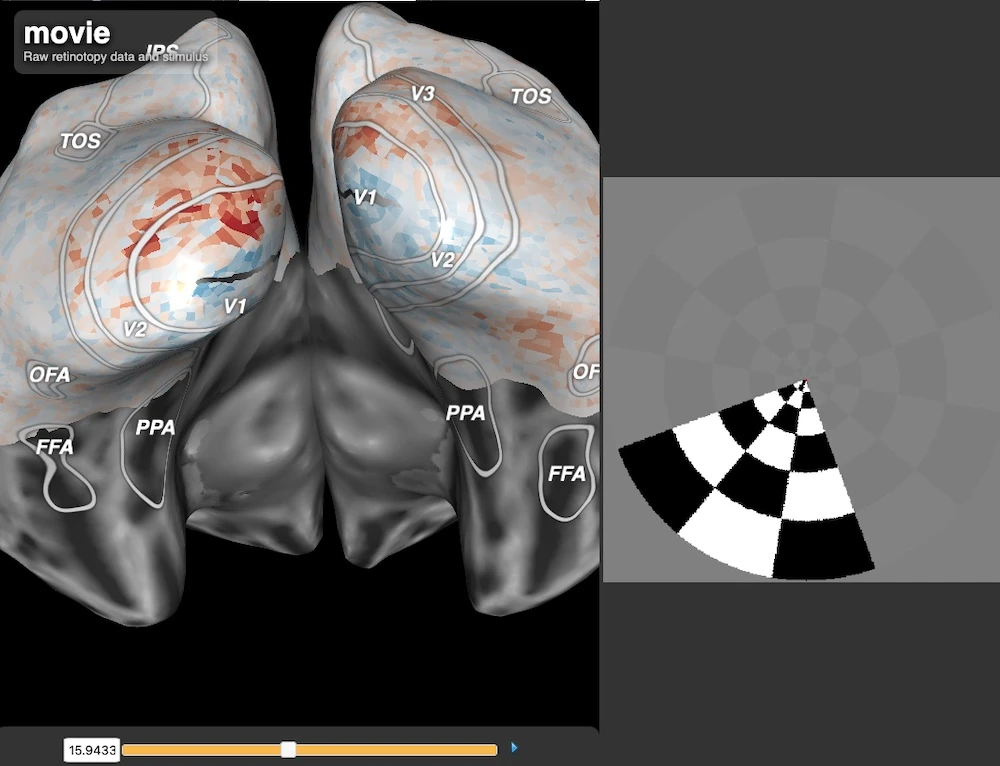
The human brain contains many different retinotopic maps, and these maps are one of the primary tools used to parcellate the visual system. Given the large number of maps and their complicated spatial relationships to one another, it is often difficult for students to fully understand how the maps are related. This viewer shows real-time functional activity evoked in a retinal mapping experiment. By identifying the angular and eccentricity functional maps one can gain a good understanding of retinotopic organization.
