Note
Go to the end to download the full example code.
Visualizing the motion energy filters
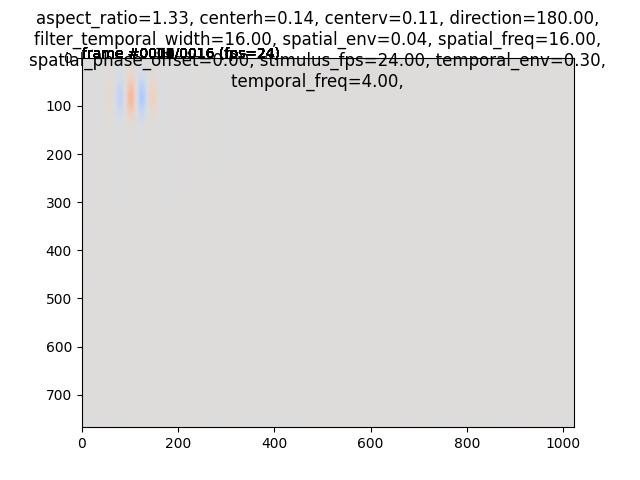
This example demonstrates how to display a motion energy filter from the pyramid.
import moten

pyramid = moten.pyramids.MotionEnergyPyramid(stimulus_vhsize=(768, 1024),
                                             stimulus_fps=24)
animation = pyramid.show_filter(1337)

The animation should look something like this:
These are the filter parameters:
from pprint import pprint
pprint(pyramid.filters[1337])
{'aspect_ratio': np.float64(1.3333333333333333),
 'centerh': np.float64(0.1416666666666666),
 'centerv': np.float64(0.10624999999999996),
 'direction': np.float64(180.0),
 'filter_temporal_width': np.float64(16.0),
 'spatial_env': np.float64(0.0375),
 'spatial_freq': np.float64(16.0),
 'spatial_phase_offset': np.float64(0.0),
 'stimulus_fps': np.float64(24.0),
 'temporal_env': np.float64(0.3),
 'temporal_freq': np.float64(4.0)}
(Ignore this code block. It is needed to display the animation as a video on this website)
output = '../../docs/build/html/_downloads/example_moten_filter.mp4'
fig = animation._fig
title = 'Example filter:\ndirection of motion=180, spatial fq=16cpi, temporal fq=4Hz'
fig.suptitle(title)
animation.save(output)

# sphinx_gallery_thumbnail_number = 2
import matplotlib.pyplot as plt
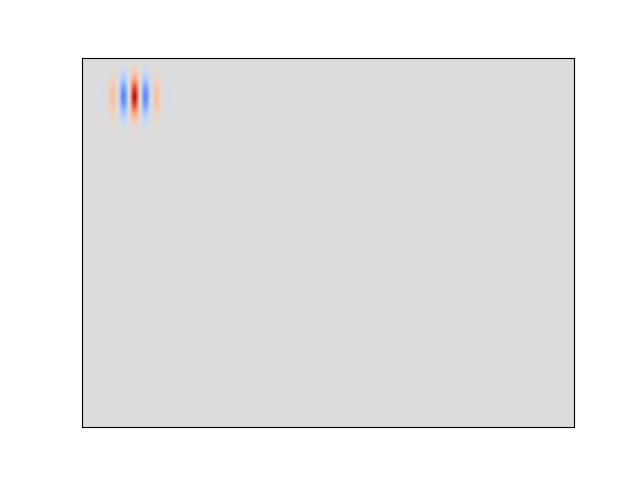
spatial_component = pyramid.get_filter_spatial_quadrature(1337)[1]
fig, ax = plt.subplots()
ax.matshow(spatial_component, vmin=-1, vmax=1, cmap='coolwarm')
__ = ax.set_xticks([])
__ = ax.set_yticks([])

Total running time of the script: (0 minutes 2.052 seconds)