Note
Go to the end to download the full example code.
Plotting a zoomed view of one ROI
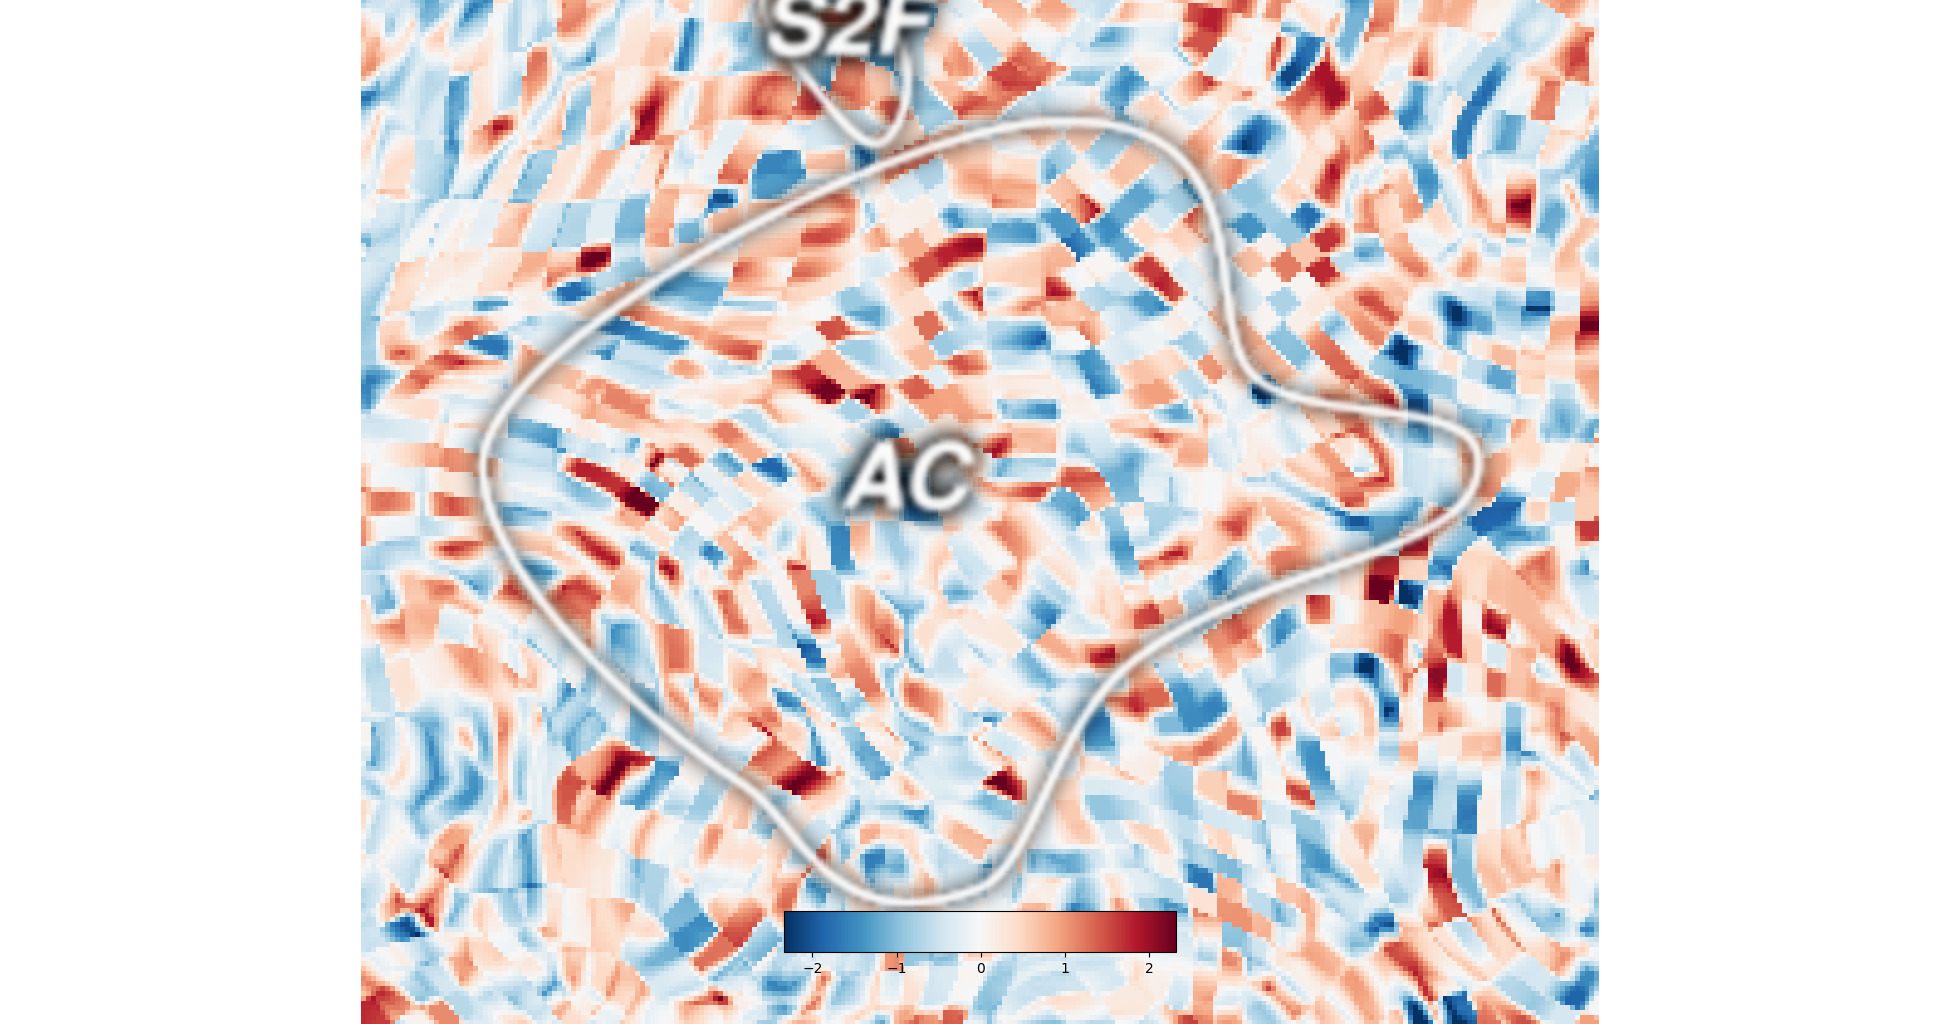
Sometimes it is useful to create a flatmap that is zoomed in one just a single ROI. The location of the ROI can be inferred automatically, making it easy to show just the region around that ROI.
** (inkscape:4811): WARNING **: 02:16:27.860: Failed to wrap object of type 'GtkRecentManager'. Hint: this error is commonly caused by failing to call a library init() function.
Generating a flatmap cache
** (inkscape:4833): WARNING **: 02:16:56.303: Failed to wrap object of type 'GtkRecentManager'. Hint: this error is commonly caused by failing to call a library init() function.
# sphinx_gallery_thumbnail_number = 2

import cortex
import numpy as np
np.random.seed(1234)
from matplotlib import pyplot as plt

def zoom_to_roi(subject, roi, hem, margin=10.0):
    roi_verts = cortex.get_roi_verts(subject, roi)[roi]
    roi_map = cortex.Vertex.empty(subject)
    roi_map.data[roi_verts] = 1

    (lflatpts, lpolys), (rflatpts, rpolys) = cortex.db.get_surf(subject, "flat",
                                                                nudge=True)
    sel_pts = dict(left=lflatpts, right=rflatpts)[hem]
    roi_pts = sel_pts[np.nonzero(getattr(roi_map, hem))[0],:2]

    xmin, ymin = roi_pts.min(0) - margin
    xmax, ymax = roi_pts.max(0) + margin
    plt.axis([xmin, xmax, ymin, ymax])

# Create dataset
data = cortex.Volume.random('S1', 'fullhead')

# Plot it using quickflat
cortex.quickshow(data)

# Zoom on just one region
zoom_to_roi('S1', 'AC', 'left')

# notice that the quality of this figure is now quite poor/grainy
# we can improve this by changing the 'height' argument to quickflat

cortex.quickshow(data, height=2048)
zoom_to_roi('S1', 'AC', 'left')
Total running time of the script: (0 minutes 35.663 seconds)

