Note
Go to the end to download the full example code.
Plot a 2D static flatmap
quickflat visualizations use matplotlib to generate figure-quality 2D flatmaps.
Similar to webgl, this tool uses pixel-based mapping to project functional data onto the cortical surfaces.
This demo will use randomly generated data and plot a flatmap. Different options to visualize the data will be demonstrated.
Some words on the `rechache` parameter before we begin:
Setting the recache=True parameter recaches the flatmap cache located in <filestore>/<subject>/cache. By default intermediate steps for a flatmap are cached after the first generation to speed up the process for the future. If any of the intermediate steps changes, the flatmap generation may fail. recache=True will load these intermediate steps new. This can be helpful if you think there is no reason that the quickflat.make_figure to fail but it nevertheless fails. Try it, it’s magic!


import cortex
import matplotlib.pyplot as plt
import numpy as np
np.random.seed(1234)
# Create a random pycortex Volume
volume = cortex.Volume.random(subject='S1', xfmname='retinotopy')
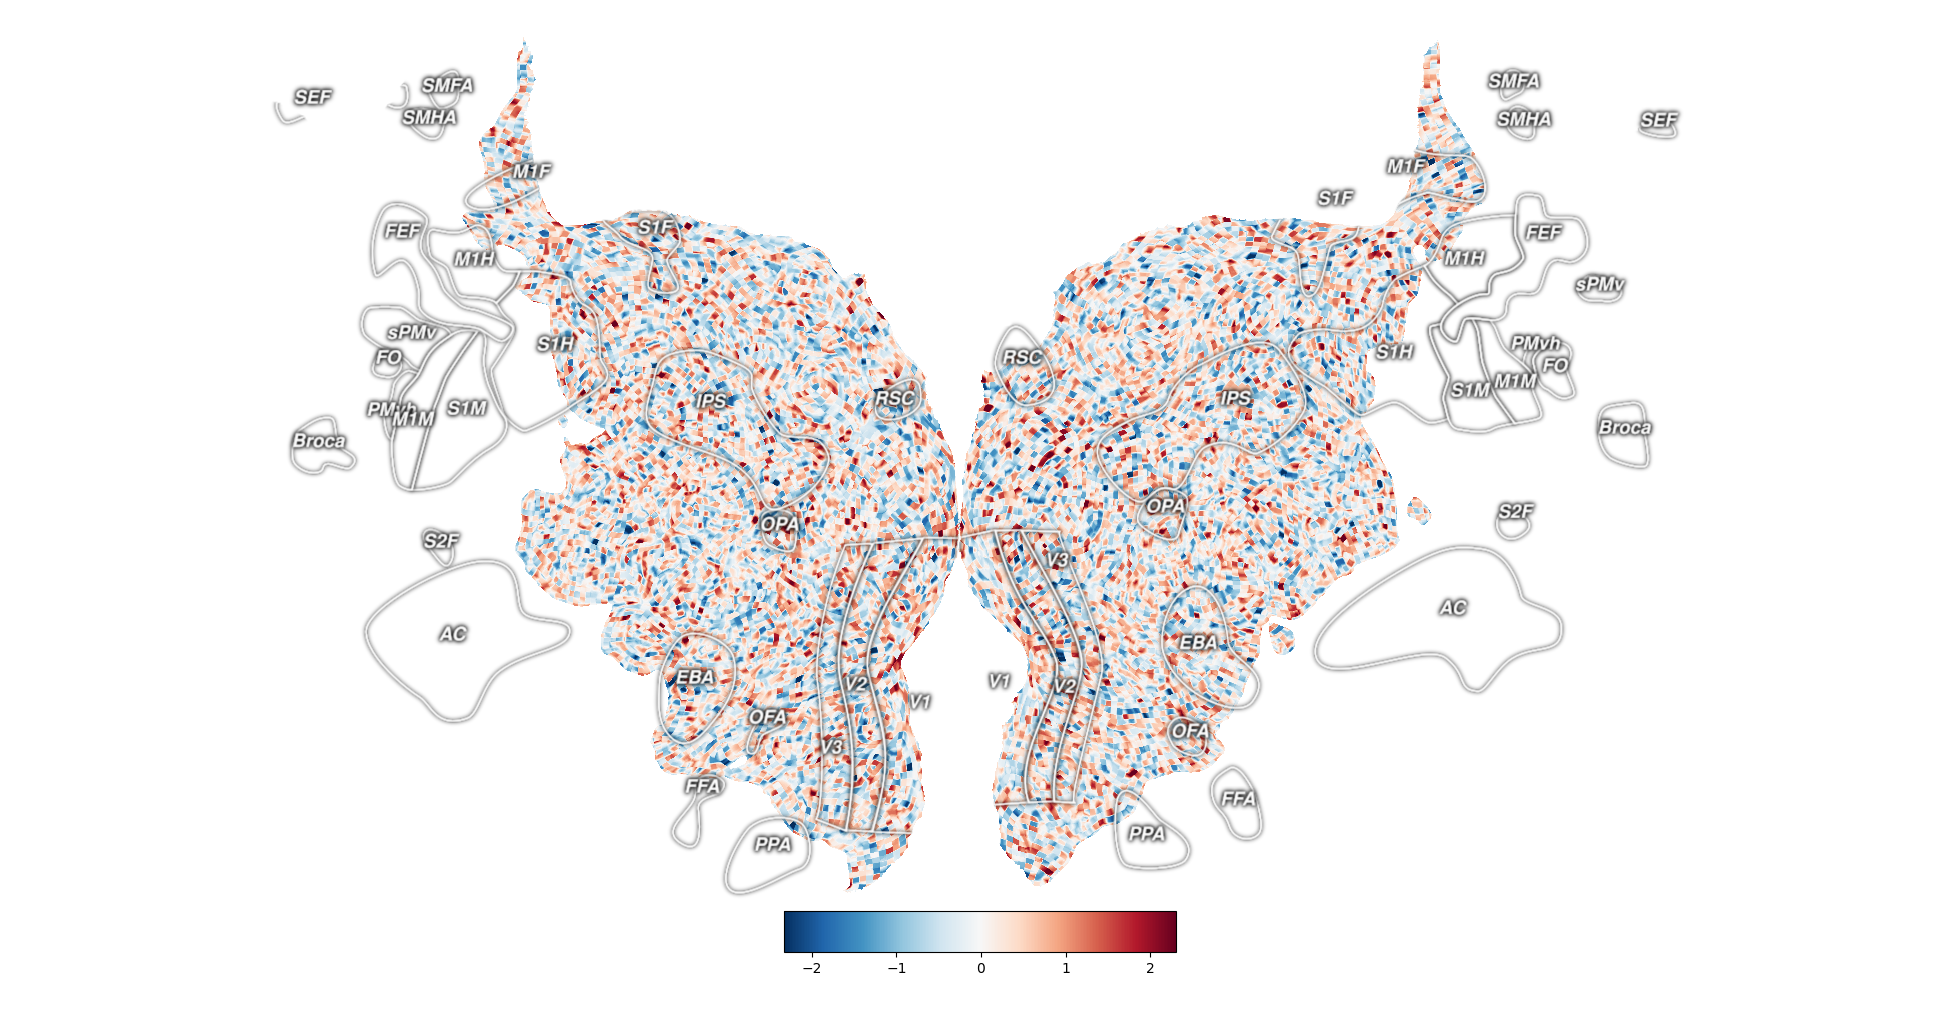
# Plot a flatmap with the data projected onto the surface
# By default ROIs and their labels will be overlaid to the plot
# Also a colorbar will be added
_ = cortex.quickflat.make_figure(volume)
plt.show()
# The cortex.quickshow method is a pointer to quickflat.make_figure
# and will plot exactly the same as the above plot
_ = cortex.quickshow(volume)
plt.show()
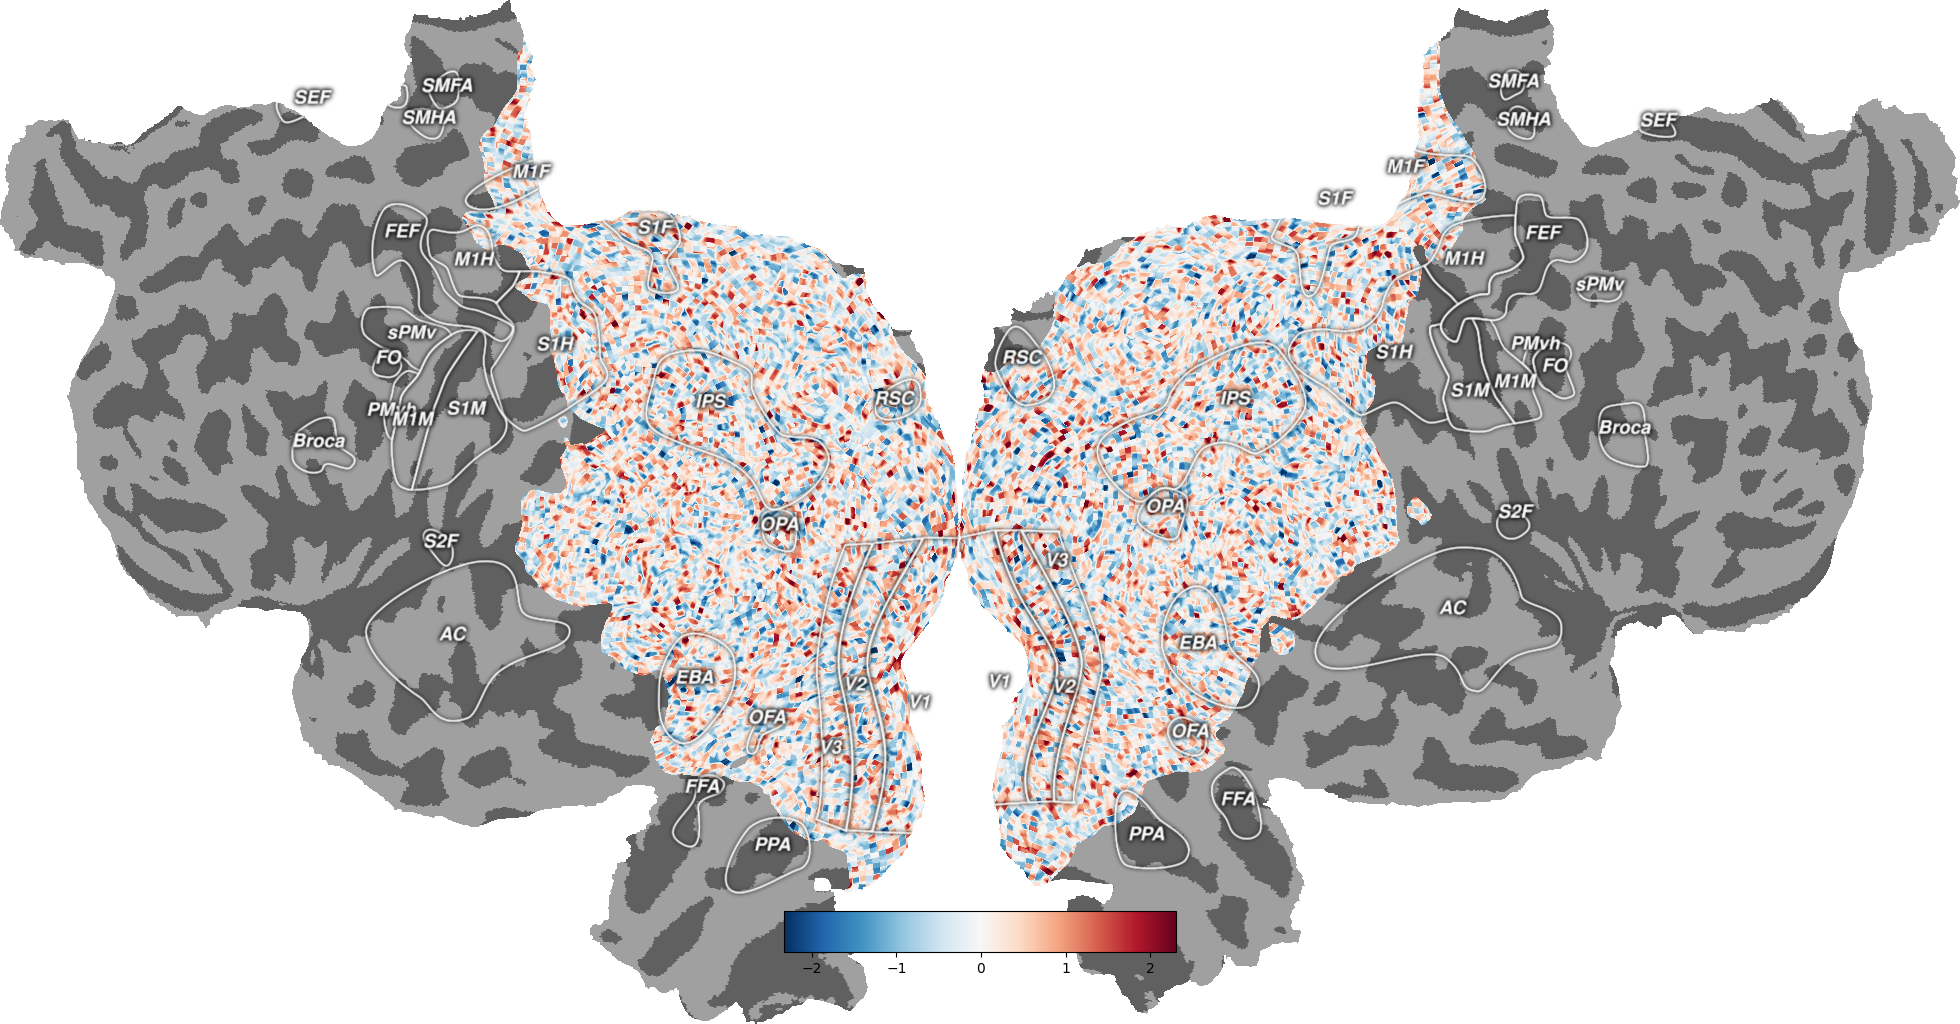
# Highlight the curvature
_ = cortex.quickflat.make_figure(volume, with_curvature=True)
plt.show()
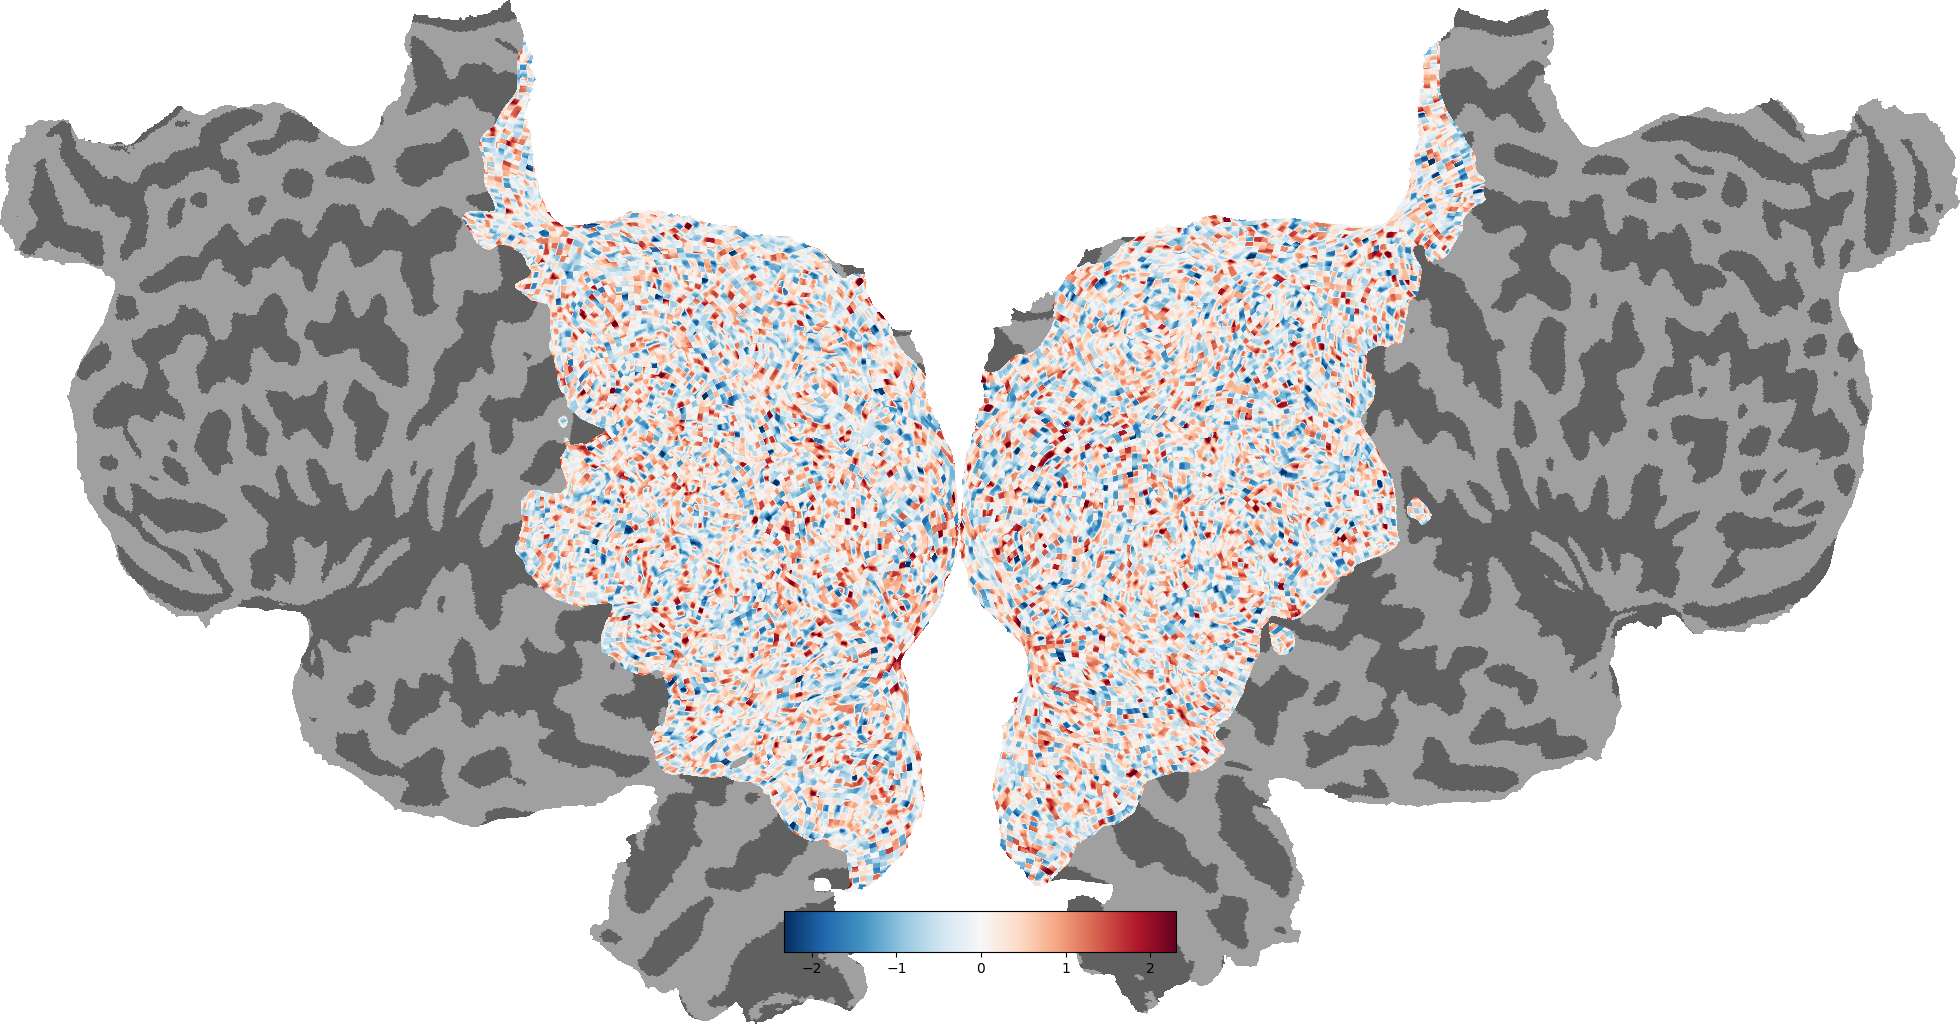
# Remove ROI labels from the plot
_ = cortex.quickflat.make_figure(volume,
with_curvature=True,
with_labels=False)
plt.show()
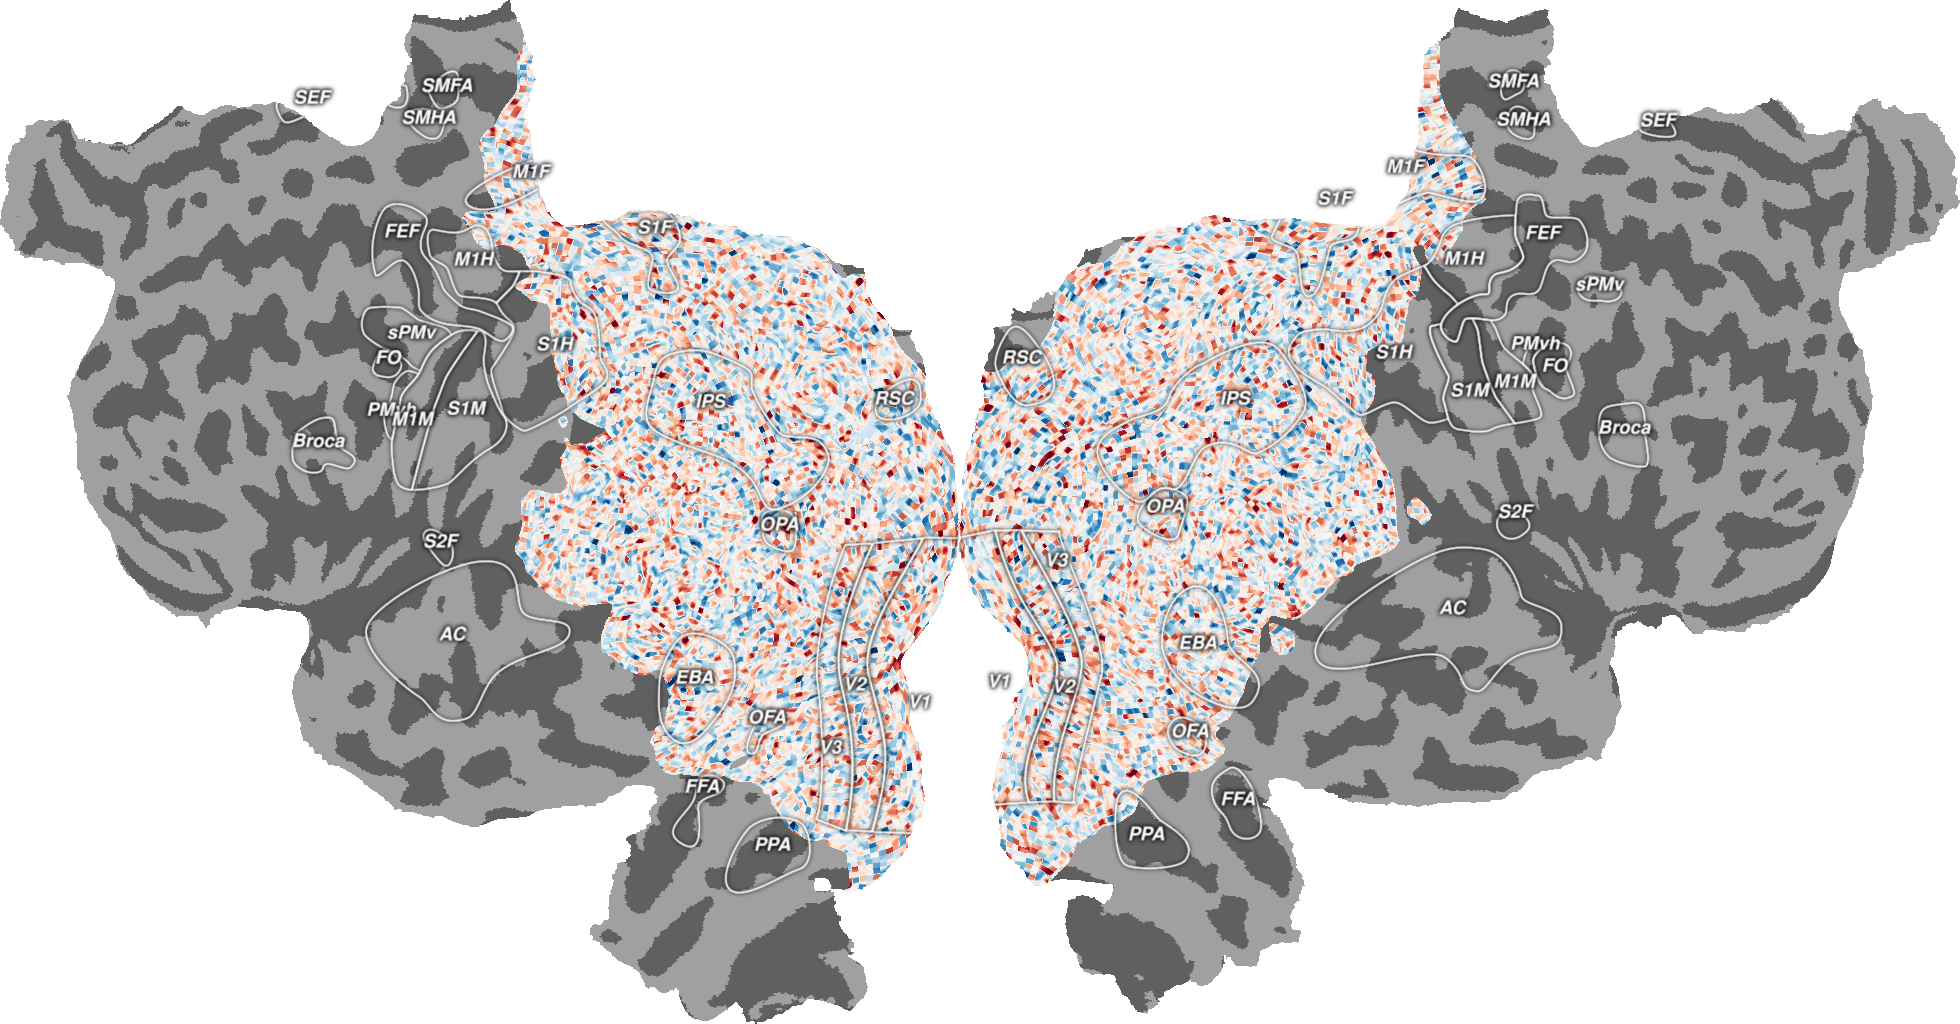
# Remove ROIs from the plot
_ = cortex.quickflat.make_figure(volume,
with_curvature=True,
with_rois=False)
plt.show()
# Remove the colorbar from the plot
cortex.quickflat.make_figure(volume,
with_curvature=True,
with_colorbar=False)
plt.show()
Total running time of the script: (0 minutes 7.790 seconds)