Note
Go to the end to download the full example code.
Plot ROIs on the flatmap
ROIs are defined as sub-layers of the roi layer in <filestore>/<subject>/overlays.svg
By default, ROIs and ROI labels are displayed when a flatmap is plotted using quickflat.make_figure.
with_labels=False turns off the ROI labels. with_rois=False turns off the ROI display.
import cortex
import numpy as np
import matplotlib.pyplot as plt
np.random.seed(1234)
# Create a random pycortex Volume
volume = cortex.Volume.random(subject='S1', xfmname='fullhead')
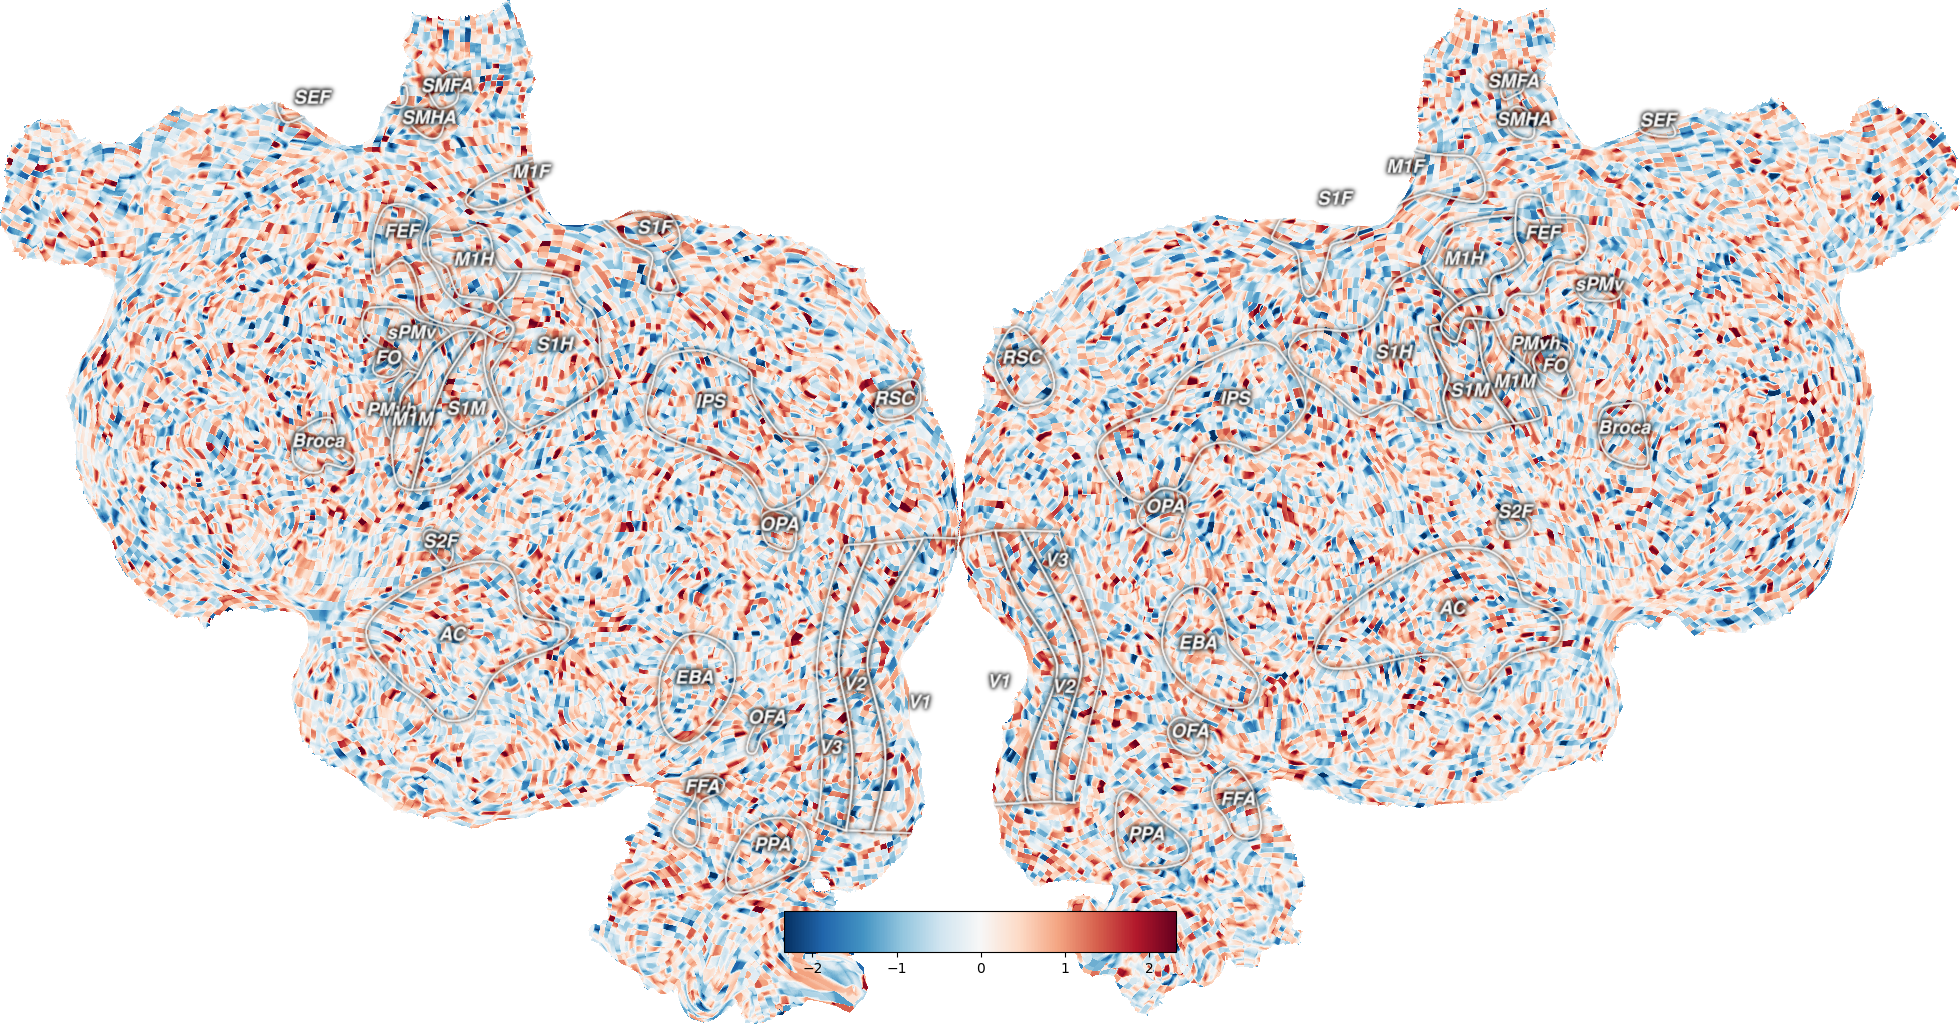
# Plot a flatmap with the data projected onto the surface
# By default the ROIs and their labels will be displayed
_ = cortex.quickflat.make_figure(volume)
plt.show()
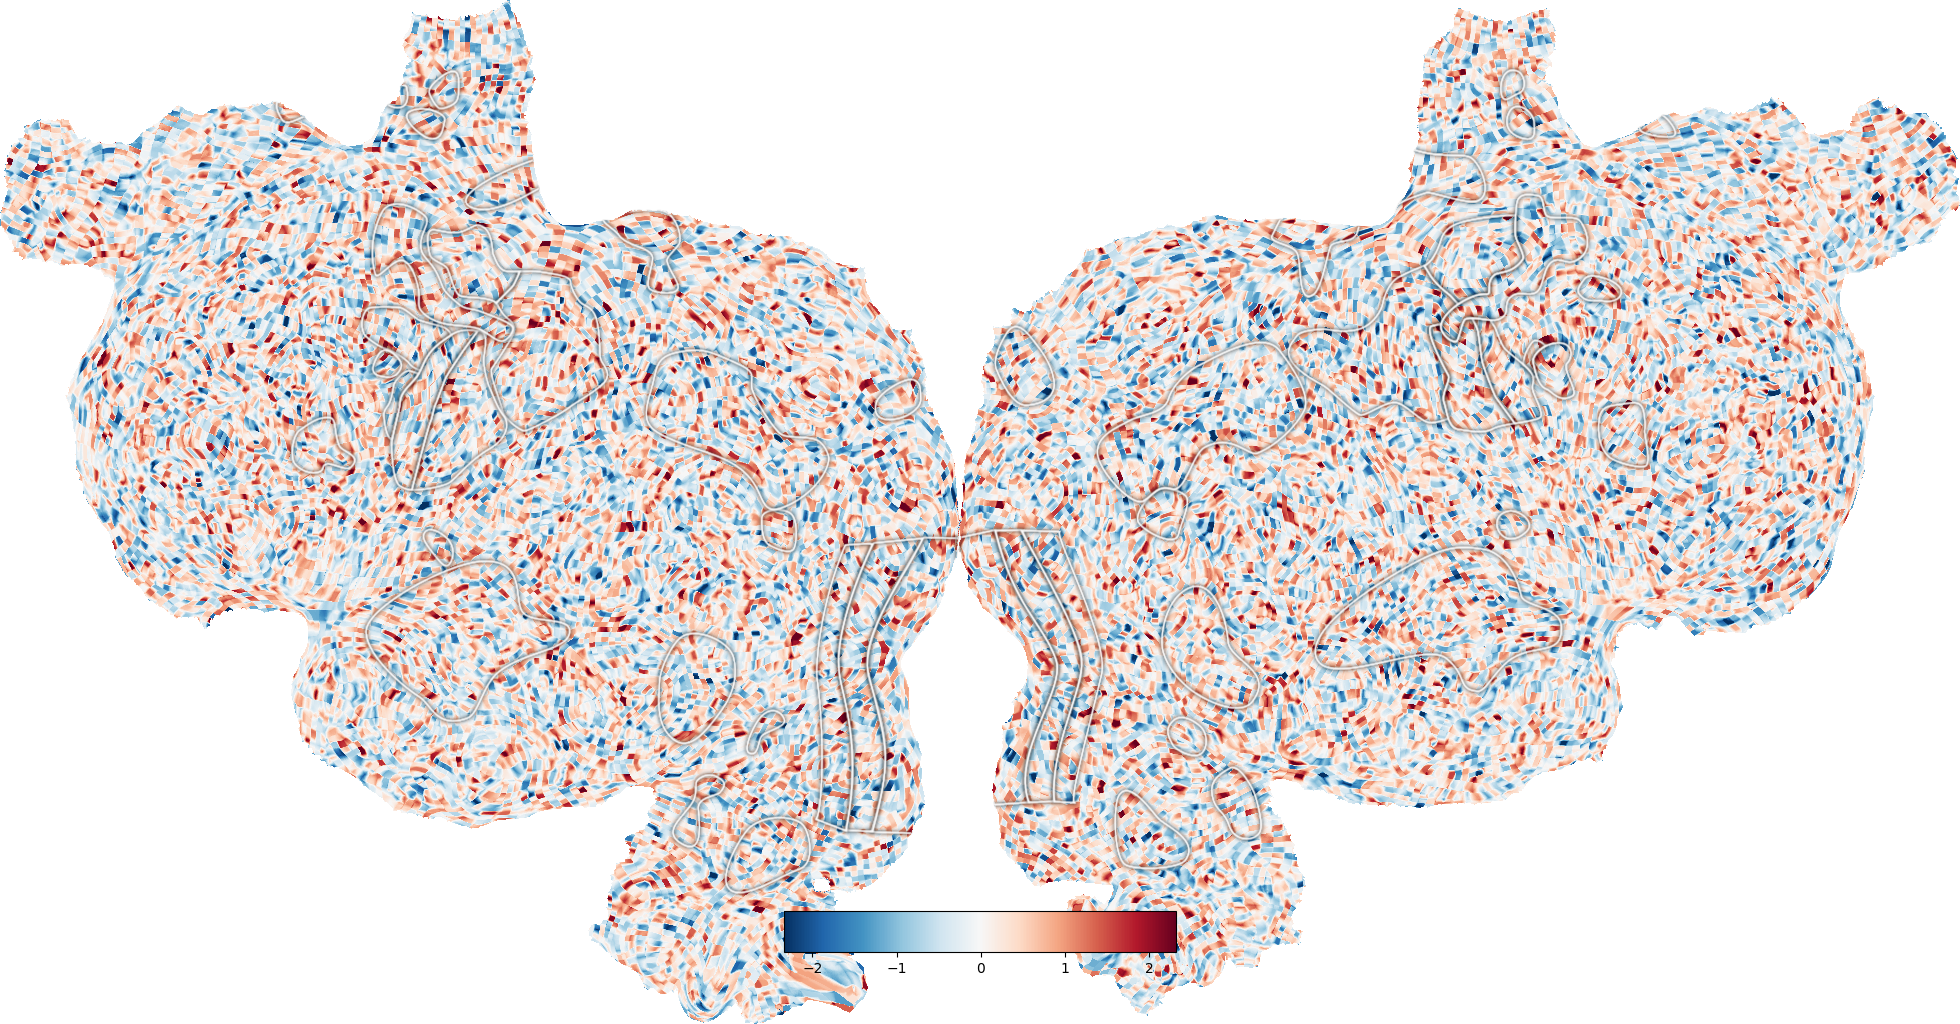
# Turn off the ROI labels
_ = cortex.quickflat.make_figure(volume, with_labels=False)
plt.show()
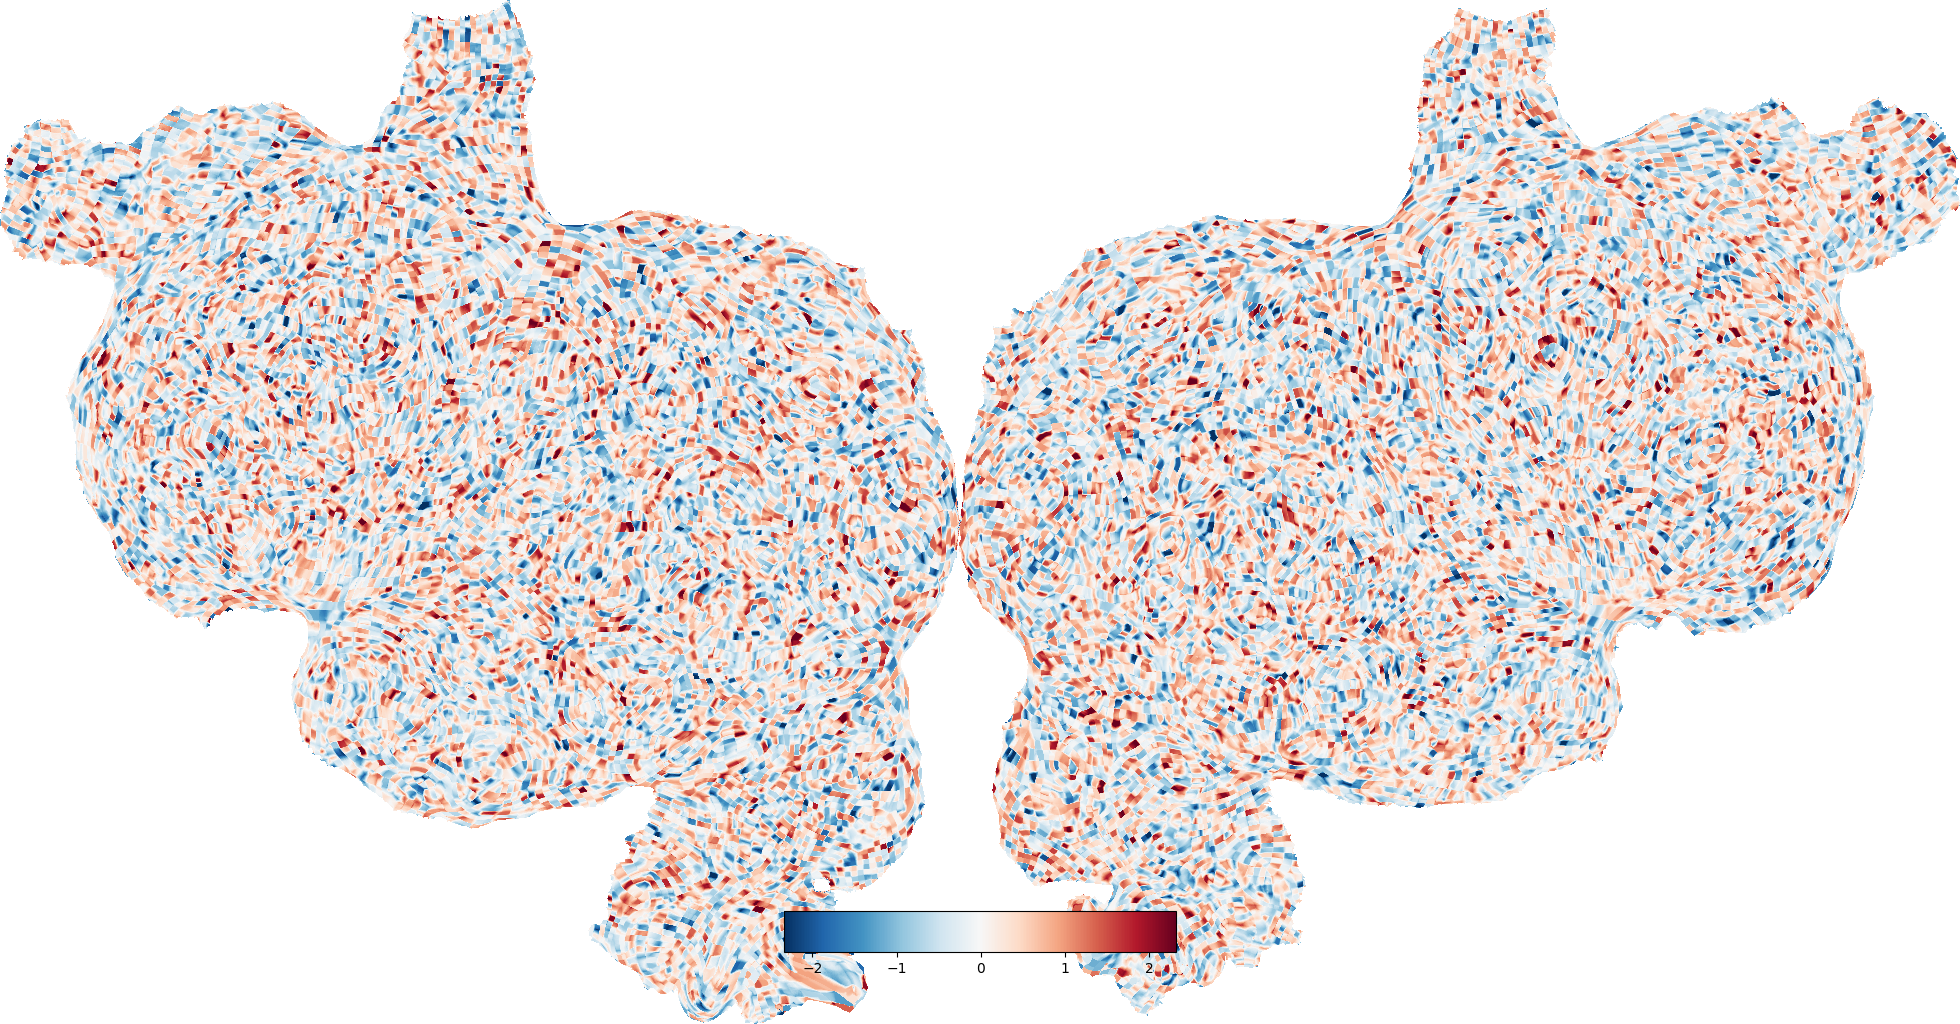
# Turn off the ROIs
_ = cortex.quickflat.make_figure(volume, with_rois=False)
plt.show()
Total running time of the script: (0 minutes 3.686 seconds)